27 August 2024
Please refer to the Important Notice at the end of this article1
The global economy is on track to grow slightly above 3% in calendar year 2024 (CY24), similar to last year, but with a more favourable combination of financial conditions and easing inflation. Normalisation of cost inflation is proceeding at a staggered pace across the ex-China world, with “last-mile” challenges evident in many jurisdictions.
Major economies are expected to continue to diverge in their growth outlooks, with developed economies facing less of a drag from higher interest rates, China experiencing an uneven recovery among its end-use sectors, and India likely to continue as the fastest growing major economy. Geopolitical risks remain elevated in the near term.
Metals have outperformed steelmaking raw materials on price in the first half of CY24. After the price decline in the first quarter of the calendar year, iron ore and steelmaking coal have been trading within relatively narrow ranges since. Copper has performed well, with a notable run-up in May on anticipated tight fundamentals and easing global financing conditions. However, most commodities have been retreating since then on worries of softening end-use demand and rising stock levels.

.gif?h=229&w=500&hash=B56F26C6C8B98CECEEE8177F69A04B31)


We expect volatility in commodity markets to continue over the next 18 months, with a general trend of rising stocks across steel-making raw materials and the non-ferrous industries. Having updated our expectations for near–term supply–demand balances (where a surplus means rising inventories and a deficit means inventories are running down), we now forecast the following: refined copper is expected to move towards a marginal surplus, alongside a very tight situation in copper concentrate. We continue to see a sizable but narrowing surplus in nickel. We now anticipate a widening surplus in the iron ore market on average across CY24, with supply likely to continue to outpace demand into CY25. We see a mild surplus for all seaborne steelmaking coals across CY24, but the supply of higher quality coals remains moderately tighter than the market as a whole. The global potash market is close to emerging from the dramatic events of recent years and balance is in sight.
Beyond the immediate horizon, we see copper pricing moving into a phase of durable outperformance, while steel-making raw materials are expected to enter an era of adjustment. The conclusion of China’s crude steel plateau phase, India’s rapid steel capacity growth, new entrants in iron ore seaborne trade, uncertain operational performance in steelmaking coal, and the complexities that will come with greater efforts to decarbonise, will all have an influence on steel value chain trade flows. We expect potash to continue to benefit from the intersection of rising population, improving living standards and changing diets.
We remain optimistic that the basic elements of our positive long–term view remain in place.
Population growth, urbanisation, the infrastructure of decarbonisation, capital stock replacement and rising living standards are expected to drive demand for steel, non–ferrous metals, and fertilisers for decades to come.
Steel and pig iron
Global steel and pig iron production growth in CY23 was primarily led by China and India, with developed regions continuing to decline. Over the remainder of CY24 and into CY25, we expect a modest improvement in global steel output: India and Southeast Asia are set to contribute the most to growth, with some additional recovery in developed regions (starting from a low base).
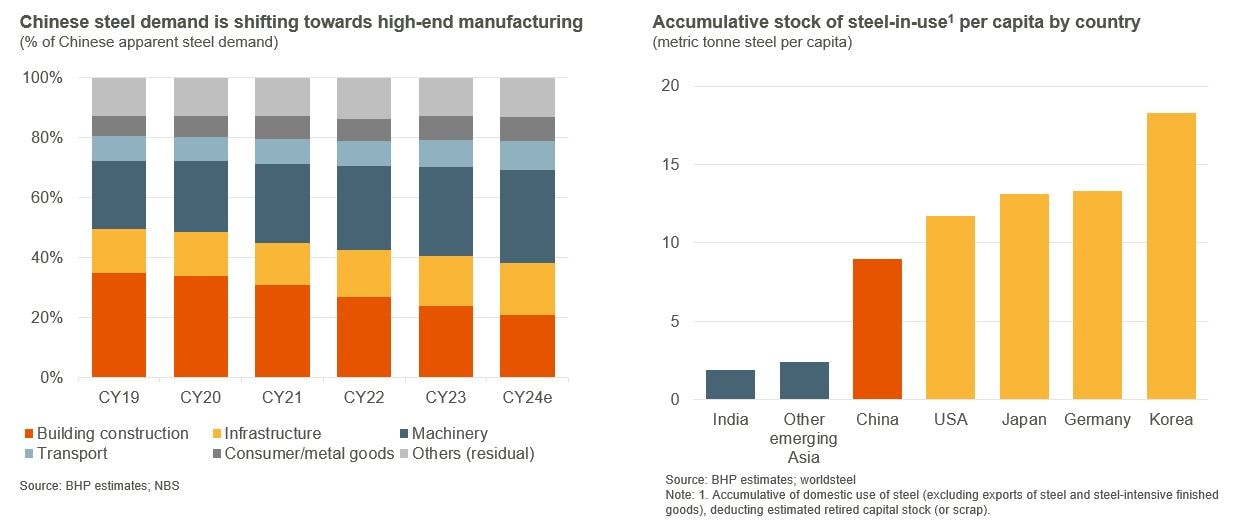
The Chinese economy is expected to achieve its official growth target of “around 5%” in CY24 with outcomes varying across end-use sectors. Over the past few years, China has seen a steady recovery in manufacturing and export-oriented sectors, with the “New Three” of solar, electric vehicles (EVs) and batteries expanding extremely rapidly. However, a major transition is still underway within the steel-intensive real estate sector, with housing starts – the key indicator for steel use in real estate – continuing to decline in the first half of CY24. Policymakers have acknowledged that more support is needed for the real estate sector, and in the middle of the year, a more decisive policy pivot emerged toward “destocking” excess housing supply. We are cautiously optimistic that the shift and more recent fiscal and monetary stimulus will lead to a bottoming of the sector in CY25, first for housing sales and then for construction activity.
Iron ore
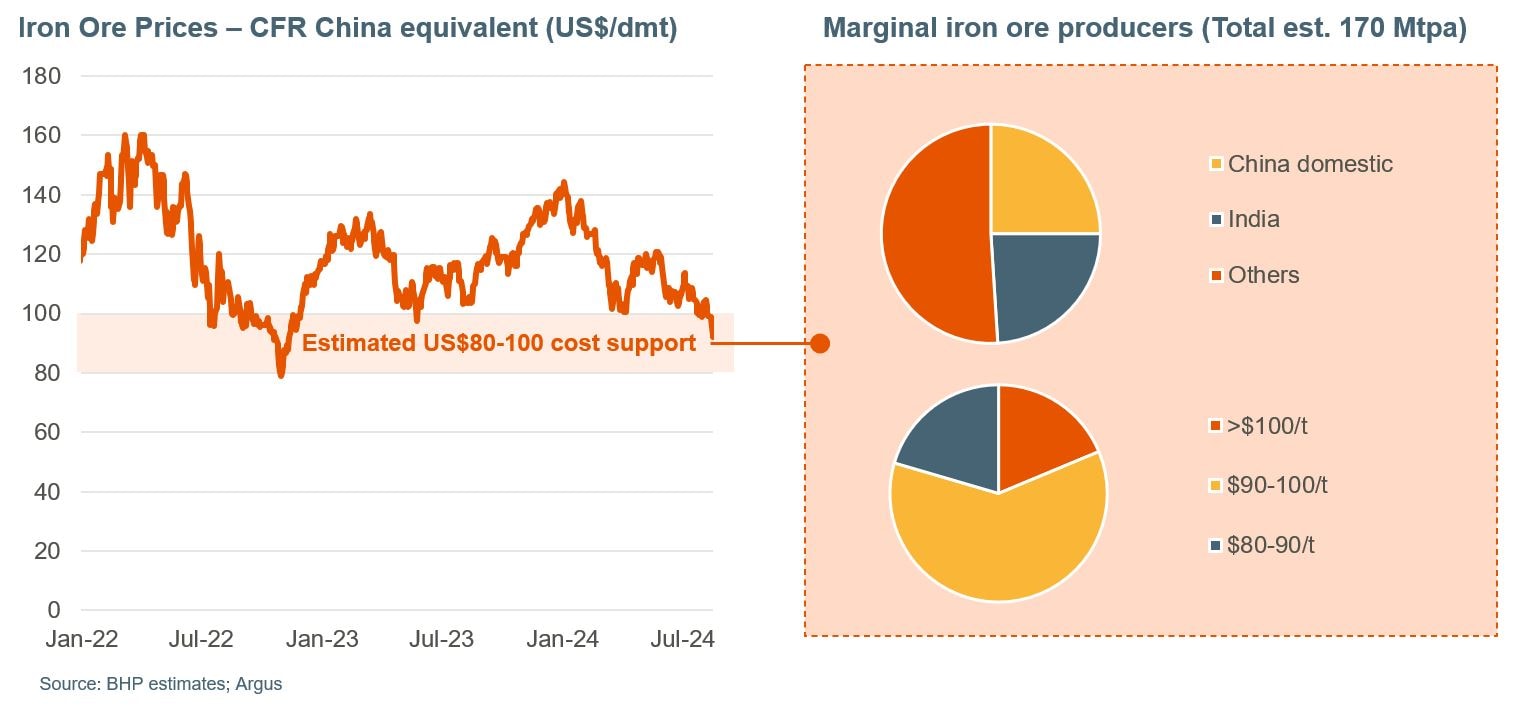
Iron ore price first declined and then traded within the range of $100-120/t during much of the first half of CY24. As we enter the second half of the year, we expect port stocks to remain elevated (they have grown to 150Mt in the first six months of the year) amid a widening surplus, which will a likely continue into CY25.
Our estimate of cost support remains at $80–100/t CFR. In the first half of the year, the top of this range held firm, with marginal seaborne supply coming under pressure when prices approached the $100/t mark, and any dips below that threshold unable to persist for long. As we have entered the second half of the calendar year, prices have dipped further into the range over the seasonal low demand period. Meanwhile, shipments from some high-cost suppliers (e.g. Indian fines) have also declined in tandem.
The reliability of the cost support range in recent periods is partly due to the fact that there are three differentiated envelopes of supply contributing to a relatively dense shield of support: higher–cost juniors in Australia, Brazil and other regions, the shoulder of the Chinese domestic mine cost curve and lower–grade Indian exports. We estimate that over 130-140 Mt of supply has a CFR cost above $90/t, with a further 30-40 Mt sitting between $80-90/t, at spot2 exchange rates, freight rates and quality differentials. Of this amount, about 75% is seaborne and 25% is domestic Chinese concentrates. To persistently dip below the lower end of the cost support range, some combination of lower demand and higher low-cost supply would have to emerge that meant the approximately 170 Mt of supply (enough to produce 10% of Chinese pig iron) is no longer required.
Steelmaking coal
Price volatility remained a feature of the steelmaking coal industry over the last twelve months, but relative to the wild price swing seen in the early 2020s, the magnitude of change in the first half of CY24 was modest.
The regional demand picture was mixed with strong steel production growth in India and Southeast Asia, and recovery in Europe, offsetting output contractions in Northeast Asia. On the supply side, operational challenges have remained a regular feature of the market, with only small improvements reported to date this year. For CY25, overall seaborne supply in the steelmaking coal market is expected to be in mild surplus as supply continues to recover, but the supply of premium coals should stay relatively tight.
China’s reliance on the seaborne market has become limited over the last few years, particularly with more landborne imports from Mongolia (CY23 imports reached 54 Mt, up almost 60% from CY19 levels). With India firmly embedded as the largest and fastest growing steelmaking coal import region, the likelihood of seaborne trade clearing in India has increased.
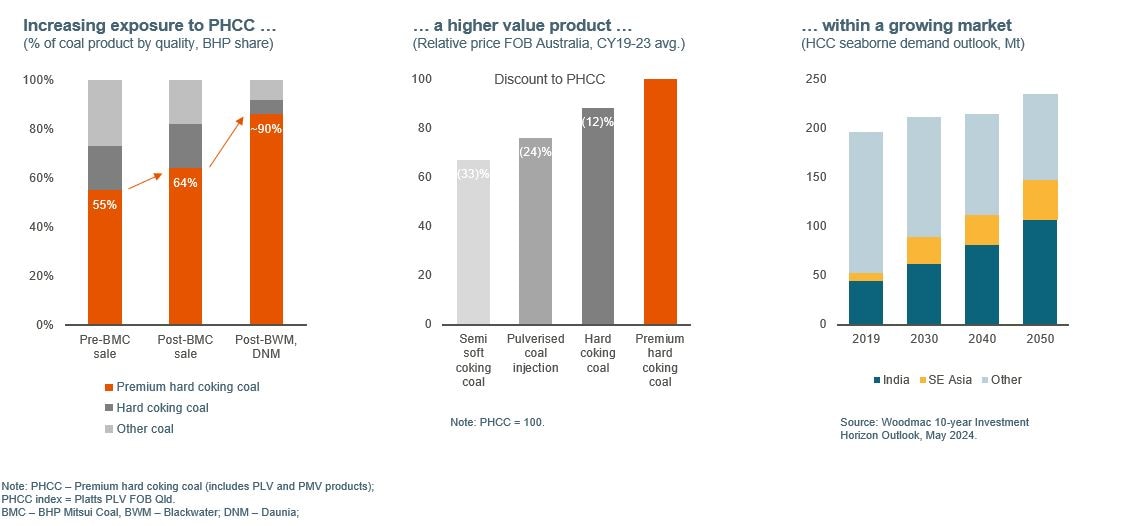
Longer term, we argue that a policy focus on sustainable development in Chinese coal mining, in addition to the drive towards decarbonisation for steel making, should highlight the competitive value of using higher–quality coals at China’s coastal integrated mills. China’s steel industry is still in the optimisation phase of its decarbonisation journey, in which these higher-quality materials can improve energy efficiency and so reduce greenhouse gas (GHG) emissions intensity for the BF–BOF route, which accounts for around 90% of Chinese crude steel production.
Our analysis also suggests blast furnace iron making, which depends on coke made from steelmaking coal, is unlikely to be displaced at scale by emergent technologies for decades. The argument hinges partly on the sheer size of the existing stock of BF–BOF capacity (70% of global capacity today) and the still quite young BF fleet in China – the major producer, but also on the large amount of new BF capacity expected to come online in India and Southeast Asia in the coming decade.
That is to say nothing of the large challenges still facing nascent zero to low emissions intensity steelmaking technology around the world today. We are acutely aware of progress being made in this space, as we highlight in the BHP CTAP 2024.
In terms of steelmaking coal supply, most committed and prospective projects are expected to be mid quality or lower, while industry intelligence implies that some mature assets that have historically produced higher-quality coals are drifting down the quality spectrum as they age.
According to Wood Mackenzie, new hard coking coal projects will be needed by the early 2030s to meet projected demand under its base case outlook.
Copper
After spending the first three quarters of the Financial Year hovering in the low-mid $8,000s, copper prices surged sharply higher in the final quarter. Investor exuberance, buoyed by optimistic copper investment theses and news of potential production cuts at Chinese copper smelters, culminated in a short squeeze on COMEX (the main exchange for trading metals in the US). The LME official settlement price set a new record of $10,857/t on 20 May 2024, with COMEX trading even higher. Lacking solid fundamental support, however, prices have fallen back swiftly.
Chinese copper demand enjoyed a robust CY23 (+6% YoY), consisting of healthy growth across end-use sectors and also strong demand from energy transition sectors (i.e. EVs, renewable power generation). After the very strong year, CY24-25 is expected to be a period of consolidation with performance mixed across sectors, resulting in more modest growth of +1-2%YoY. This is a downgrade to our prior expectations, which reflects the ongoing shift in the Chinese real estate market. In particular, housing completions—the major indicator for copper end-use in housing—is expected to contract sharply in CY24.
After the weakness of recent years, OECD economies are expected to stage a modest demand recovery over the next 18 months, with the US bouncing back more rapidly than Europe and Japan. India’s demand growth also continues to be a bright spot (albeit from a relatively small base).
Mine supply experienced a tumultuous CY23, punctuated by unexpected mine closures and guidance downgrades for CY24. This year, mine supply has not yielded many surprises so far, with disruptions generally in line with the 5% historic average. The events of CY23 did create a lower starting point, and as a result, mine supply in CY24 should grow at slightly less than +2% YoY, before improving to +4% YoY in CY25. Behind these global figures sit disparate regional trends, with African supply rising strongly while the Americas stay relatively stagnant, if not in decline. Chinese investment in the Democratic Republic of Congo has been a key driver in doubling production in that country over the past five years, allowing it to grow to 13% of global supply in CY24.
Considering the softer short-term demand view, the copper market is now expected to be in marginal surplus in CY24 and a slightly larger, but still modest, surplus in CY25. That said, we still expect the expected accumulation of inventory to only provide scant coverage against anticipated deficits in the latter half of this decade.
If we look ahead to the second half of the decade and beyond, there are several key features of the copper value chain that give us confidence in its long-term fundamentals.
Underpinning copper demand upside is “traditional” growth in developing countries, such as the growing use of air conditioners in India, washing machines in Bangladesh, rural electricity access in sub-Saharan Africa to displace biomass. Despite its already massive annual copper consumption, China’s stock of copper-in-use is also still only half that of the United States on a per capita basis. And India’s market is forecast to grow to be around five times larger in 2050 than pre-pandemic levels.
The energy transition—electric vehicles and the build-out of a reliable wind- and solar-based power grid—remains as a key source of upside for copper beyond the traditional levers. With electric vehicles three times as copper-intensive as internal combustion engine vehicles, we expect the transport sector to make up over 20% of global copper demand by 2040, compared to only 11% today.
Data centres will be another source of solid copper demand growth, requiring vast amounts of power and cooling (which all require copper) to deliver AI-enabled services. Demand in this sector, currently about 1% of global copper demand, could grow six-fold out to 2050.
In our estimation, the world requires about 10 Mtpa of copper supply over the next 10 years, including mine life extensions and replacement for depletions. This translated to around a quarter trillion dollars investment in the sector for the same period.
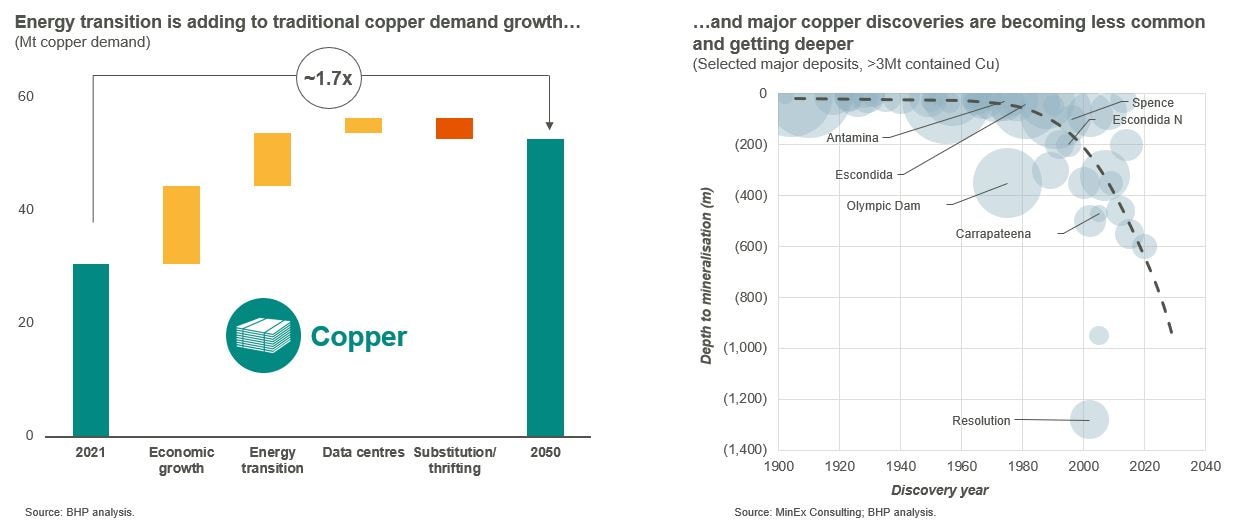
Lower grades, increased depth and complexity of deposits present significant below-ground challenges for primary supply, while growing regulatory, environmental and sustainability commitments add to the cost of developing a mine. The clear uptrend in capex estimates as project studies have been updated recently are a reflection of these challenges. Technological progress can help at the margin to improve the productivity of existing operations, including innovative leaching. However, this inflationary trend may prove stubbornly persistent.
We maintain the view that the price setting marginal tonne in the long-term copper market will come from either a lower grade brownfield expansion in a mature jurisdiction, or a higher grade greenfield in a higher risk and/or emerging jurisdiction. None of these sources of metal is likely to come cheaply, easily – or, unfortunately, promptly. Between now and then, with the deficit conditions we anticipate in the final third of the 2020s, it is possible that we enter into a “fly-up” pricing regime, whereby prices disconnect from the cost curve due to systematic excess of demand over supply amid inadequate inventory levels.
Nickel
In July 2024, BHP announced a temporary suspension of operations at Western Australia Nickel following oversupply in the global nickel market. We detailed the material deterioration in operating conditions the nickel industry has experienced at our half year results in February 2024.
The demand signposts we have observed since that release were that OECD stainless demand remained soft, re-stocking in the Chinese EV value chain was tentative, OECD EV sales under-performed, while final US guidelines on fleet emissions standards for 2027-2032 were watered down, collectively putting downward pressure on our forecasts for medium-term EV penetration rates in the world’s second largest auto market.
On the supply side of the industry, we observed additional curtailments and project suspensions being publicly announced, slower than expected mining approvals in Indonesia both pre-and-post the presidential election, the LME suspending Russian metal deliveries in response to US and UK sanctions, and civil unrest in New Caledonia (~6% of global nickel mined supply). The net impact of these fundamental signposts was not enough to alter our view that the nickel industry is likely in an extended run of annual surpluses stretching into the decade’s final third.
Turning to the longer–term fundamentals, we still believe that nickel will be a substantial beneficiary of the global electrification megatrend – and we detail the potential for an even stronger demand profile under our 1.5ºC scenario that is discussed in the BHP CTAP 2024.
Potash
Potash prices have been on a downward trend over the last eighteen months as the industry unwinds from the fly-up pricing regime following the severe supply disruptions of recent years. The magnitude of price movements in the first half of CY24 was less pronounced compared to a year ago.
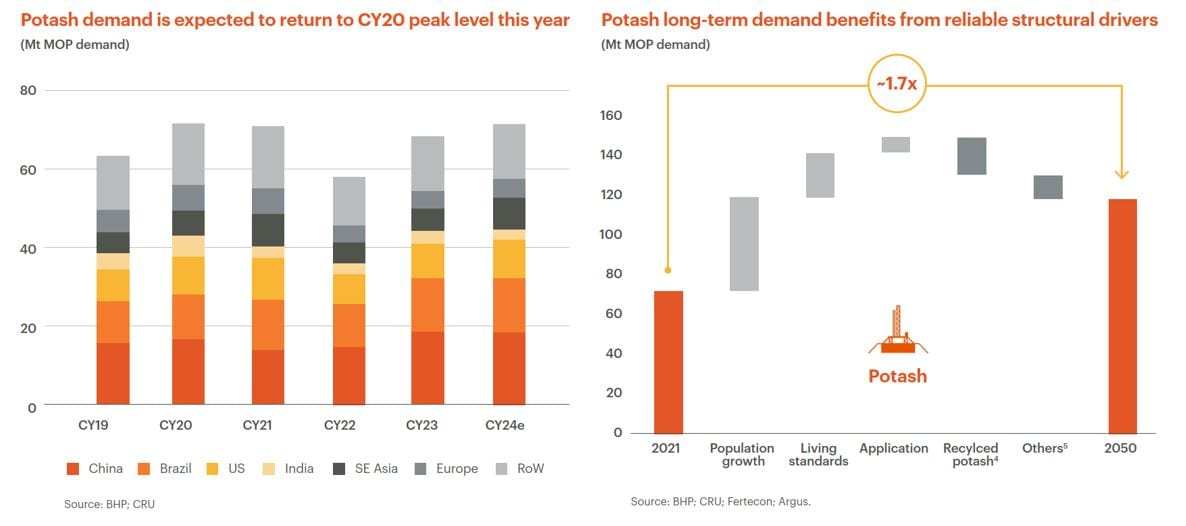
Looking at regional demand performance, a broad-based recovery continued from the lows of CY22, with total MOP deliveries expected to reach (or exceed) pre-Ukraine conflict levels in CY24. Supply also increased further with export volumes from Russia and Belarus edging closer to their CY21 peak, and Laos adding 2-3Mt capacity over the last few years. Canadian volumes this year point to an improved production versus last, although incumbents have been more circumspect on short to medium term expansion plans.
In aggregate, the market seems to be headed towards balance with improvements in both demand and supply as outlined above. Balanced though does not mean that the market is “at rest”. The industry remains in the midst of a significant disequilibrium, slowly adjusting from the major shocks of recent years.
Longer-term, we feel potash offers attractive fundamentals. Demand stands to benefit from the intersection of global megatrends: rising population, improving living standards, changing diets and the need for the "sustainable intensification of agriculture".
The compelling demand picture, rising geopolitical uncertainty and the maturity of the existing asset base collectively provide an attractive, accelerated entry opportunity in a lower–risk supply jurisdiction such as Saskatchewan, Canada.
The phrase “sustainable intensification of agriculture” includes both the need to improve yields on existing land in the face of depleted native soil fertility, but also to begin factoring in the long run land–use implications of: large–scale first–generation biofuel production, lower availability of crop residues as an alternate supply of potassium to chemical fertiliser6 under large–scale second-generation biofuel production (e.g. Sustainable Aviation Fuel), the need for industrial scale renewables build-out and nature–based solutions to climate change. To be clear though, we consider that the impact of deep decarbonisation on potash demand is best characterised as attractive upside on top of an already compelling demand case: not a case in itself. For more information on how we envision potash performing in our 1.5ºC scenario, see the BHP CTAP 2024.
Inputs and inflation trends
Inflation continues to ease globally following the extraordinary post-Covid spike that started in CY21. However, inflation typically flows through to our business with a lag, and the pace and extent of the inflationary downswing has differed across our key cost exposures.
- Economy-wide measures of inflation continue to ease, and are expected to broadly normalise over FY25.
- Energy costs have come down considerably from the extreme highs following the start of the Ukraine conflict, but ongoing supply issues have prevented prices from returning to pre-Covid levels.
- Non-energy raw-materials and logistics costs largely returned to pre-Covid norms over the course of FY23 and entered into more typical cyclical variations over FY24. However, supply disruptions have pushed some costs higher over the past six months.
Focusing on some key cost drivers, wage growth has started to ease in both Australia and Chile. In Australia, growth peaked at a 15-year high of 4.3% YoY in the second quarter of FY24 and has been on a decline since. Nevertheless, growth remains elevated, particularly in the context of recent weak productivity outcomes, with current levels of GDP per hour worked broadly where they were four years ago. Discontinuing this trend is arguably the most urgent task facing all levels of government across Australia. In Chile, mining wage growth eased towards its long-run average over FY24, although recent strength in the mining sector and base effects have created significant volatility in the monthly data.
General inflation in Australia peaked at 7.8% YoY in the second quarter of FY23, and fell to 3.8% in the fourth quarter of FY24. The ‘last-mile’ towards the Reserve Bank of Australia’s target is expected to be bumpy, as services inflation takes time to ease, and variation in volatile items (such as food and energy) continues. Inflation in Chile has also eased considerably since peaking at 14% in August 2022, falling as low as 3.7% in the second half of FY24. This has prompted the Central Bank of Chile to cut interest rates by 5.5 percentage points over the 12 months to June 2024. However, inflation has been increasing again in recent months and electricity prices, which had been frozen since 2019, are due to increase in FY25.
Diesel benchmarks (both Singapore diesel [into Minerals Australia] and US Gulf Coast [into Minerals America]) finished FY24 close to where they started at ~$100/bbl, with some volatility in the year. Refinery spreads have come down from their record highs, but remain elevated relative to history. We see a potentially oversupplied crude oil market over FY25, with demand weak and OPEC+ due to gradually unwind ~40% of its production cuts. Escalation of tensions in the Middle East remains a wild card.
Australian National Energy Market (NEM) spot power prices were volatile in the second half of FY24 following a relatively benign first half. Periodic bouts of high volatility are common in the NEM. However, this is likely to worsen in the coming years as the difficulties of calibrating the exit of aging coal infrastructure with increasing penetration of intermittent renewables and immature storage infrastructure become more pronounced.
In the maritime bulk freight market, the key C5 WA–China route averaged $10.5/t in the second half of FY24, up +33% YoY. In the medium term, we anticipate that rates may rise, with very modest growth in the fleet after a period of weak orders intersecting with an expected lift in bulk volumes. The orderbook for Capesize vessels stands at ~6.65% of the fleet, versus ~12% for vessels in smaller subclasses. We also note that shipbuilding capacity is stretched across the board due to the surge in container ship orders in response to the Covid-19 pandemic crunch, in addition to a backlog of tankers, LNG/LPG vessels and car carriers.
Note: Going forward, we intend to provide future editions of BHP’s Economic and Commodity Outlook on an annual basis, rather than on a six-monthly cadence. The next iteration will be released along with BHP’s FY2025 Results.
Important notice:
This article contains forward–looking statements, which involve risks and uncertainties. Forward-looking statements include all statements other than statements of historical or present facts, including: statements regarding: trends in commodity prices and currency exchange rates; demand for commodities; global market conditions; guidance; reserves and resources and production forecasts; expectations, plans, strategies and objectives of management; our expectations, commitments, targets, goals and objectives with respect to social value or sustainability; climate scenarios; approval of certain projects and consummation of certain transactions; closure, divestment, acquisition or integration of certain assets, operations or facilities (including associated costs or benefits); anticipated production or construction commencement dates; capital expenditure or costs and scheduling; operating costs, and supply of materials and skilled employees; anticipated productive lives of projects, mines and facilities; the availability, implementation and adoption of new technologies; provisions and contingent liabilities; and tax, legal and other regulatory developments.
Forward–looking statements may be identified by the use of terminology, including, but not limited to , “intend”, “aim”, “ambition”, “aspiration”, “goal”, “target”, “prospect”, “project”, “plan”, “pathway”, “objective”, “see”, “anticipate”, “estimate”, “believe”, “expect”, “commit”, “ensure”, “may”, “should”, “intend”, “need”, “must”, “will’, “would”, “continue”, “forecast”, “guidance”, “outlook”, “trend” or similar words.
These statements discuss future expectations or performance, or provide other forward-looking information and are based on the information available as at the date of this article and/or the date of BHP’s scenario analysis processes. BHP cautions against reliance on any forward–looking statements or guidance.
Additionally, forward–looking statements in this article do not represent guarantees or predictions of future financial or operational performance, and involve known and unknown risks, uncertainties, and other factors, many of which are beyond our control, and which may cause actual results to differ materially from those expressed in the statements contained in this article.
There are inherent limitations with scenario analysis, and it is difficult to predict which, if any, of the scenarios might eventuate. Scenarios do not constitute definitive outcomes for us. Scenario analysis relies on assumptions that may or may not be, or prove to be, correct and may or may not eventuate, and scenarios may be impacted by additional factors to the assumptions disclosed.
Except as required by applicable regulations or by law, BHP does not undertake to publicly update or review any forward–looking statements, whether as a result of new information or future events. Past performance cannot be relied on as a guide to future performance.
No offer of securities
Nothing in this article should be construed as either an offer or a solicitation of an offer to buy or sell BHP securities, or a solicitation of any vote or approval, in any jurisdiction, or be treated or relied upon as a recommendation or advice by BHP. No offer of securities shall be made in the United States absent registration under the U.S. Securities Act of 1933, as amended, or pursuant to an exemption from, or in a transaction not subject to, such registration requirements.
Reliance on third party information
The views expressed in this article contain information that has been derived from publicly available sources that have not been independently verified. No representation or warranty is made as to the accuracy, completeness, or reliability of the information. This article should not be relied upon as a recommendation or forecast by BHP.
BHP and its subsidiaries
In this article, the terms ‘BHP’, the ‘Company’, the ‘Group’, ‘BHP Group’, ‘our business’, ‘organisation’, ‘we’, ‘us’ and ‘our’ refer to BHP Group Limited and, except where the context otherwise requires, our subsidiaries. Refer to the ‘Subsidiaries’ note to the Financial Statements in the BHP Annual Report for a list of our significant subsidiaries. Those terms do not include non–operated assets.
Footnotes
1 Data and events referenced in this article are current as of August 2024. All references to financial years are June–end, as per BHP reporting standards. For example, “financial year 2024” is the period ending 30 June 2024. All references to dollars or “$” are US dollars unless otherwise stated. Unless otherwise stated, the data is compiled by BHP from a wide range of publicly available and subscription sources, including national statistical agencies, Bloomberg, Wood Mackenzie, CRU, IEA, ILO, IMF, Argus, CREIS, Fertecon, FastMarkets, SMM, Parker Bay, MySteel, Platts, LME, COMEX, SHFE, ICE, DCE, SGX, and S&P Global, among others.
2 Average market exchange rates and freight costs in early August 2024 (Aug 1st to 15th).
3 See footnote 30 in BHP results presentation for the full year ended 30 June 2024 for terminology. Note that around two-thirds of our product was in the PHCC technical quality bracket pre-divestment, but three-quarters referenced the PLV index in our contracts. The slide in the results presentation is presented on the former basis, where 86% of production will meet the specifications of PHCC post-divestment.
4 Recycled potash – “Recycled potash from crops and manure.”
5 Others – “Others include changes in crop mix & physiology, other forms of potash (non-MOP sources) and supply chain losses as well as stock change.”
6 The potassium uptake of crops comes from (a) native K in the soil, (b) crop residues, (c) manures, and (d) chemical fertiliser. These shares vary widely by region, but the global averages are 30% from the soil, 20% from manures, 20% from crop residues and 30% from fertiliser. We anticipate that the fertiliser share will rise over time as soil fertility depletes.
Get the latest BHP news alerts, straight to your inbox
Get BHP news first. Stay in touch with our latest updates, investor news and media releases.


