Important notice
A fuller set of our disclosures with respect to the development of our new 1.5°C scenario and its use can be found in the BHP Climate Transition Action Plan 2024 and the content below should be read together with our Climate Transition Action Plan (CTAP) 2024.
There are limitations to scenario analysis, including any climate-related scenario analysis, and it is difficult to predict which, if any, of the scenarios might eventuate. Scenario analysis is not a forecast and is not an indication of probable outcomes and relies on assumptions that may or may not prove to be correct or eventuate, and scenarios may be impacted by additional factors to the assumptions disclosed.
How we use our planning range and our 1.5°C scenario
Our planning range refers to our long-term forecast for demand, supply and price across our commodities. It is comprised of three unique independent planning cases: a ‘most likely’ base case, and an upside case and downside case that provide the range’s boundaries. These three cases reflect proprietary forecasts for the global economy and associated sub-sectors (i.e. energy, transport, agriculture, steel) and the resulting market outlook for our core commodities. We regularly make updates to our planning range, which is informed by key signposts associated with the global economy and sub-sectors, as well as commodity markets. The modelled outputs of our planning range result in global CO2 emission pathways implying a projected global temperature increase of around 2°C by CY2100. Our planning range’s demand, supply and price forecasts for key commodities are used to inform data inputs into operational modelling and drive operational planning. Our planning range is also used for strategy formation and investment decisions.
Scenarios highlight different hypothetical pathways for the future and are not necessarily what we or others expect to happen. We use scenarios to explore different themes or end states to stress test business decisions and portfolio resilience. We include a 1.5°C scenario as one aspect of our analysis to inform our understanding of the potential impacts of an acceleration in global decarbonisation. We have used an internally developed 1.5°C scenario, benchmarked against external scenarios, to test the modelled impacts of potential pathways towards deep decarbonisation and the climate-related transition risks it would give rise to. In FY2024, we developed a new 1.5°C scenario designed to specifically test our current portfolio following the changes to our portfolio since our previous 1.5°C scenario was developed in CY2020 and presented in the BHP Climate Change Report 2020 (CY2020 1.5°C scenario).
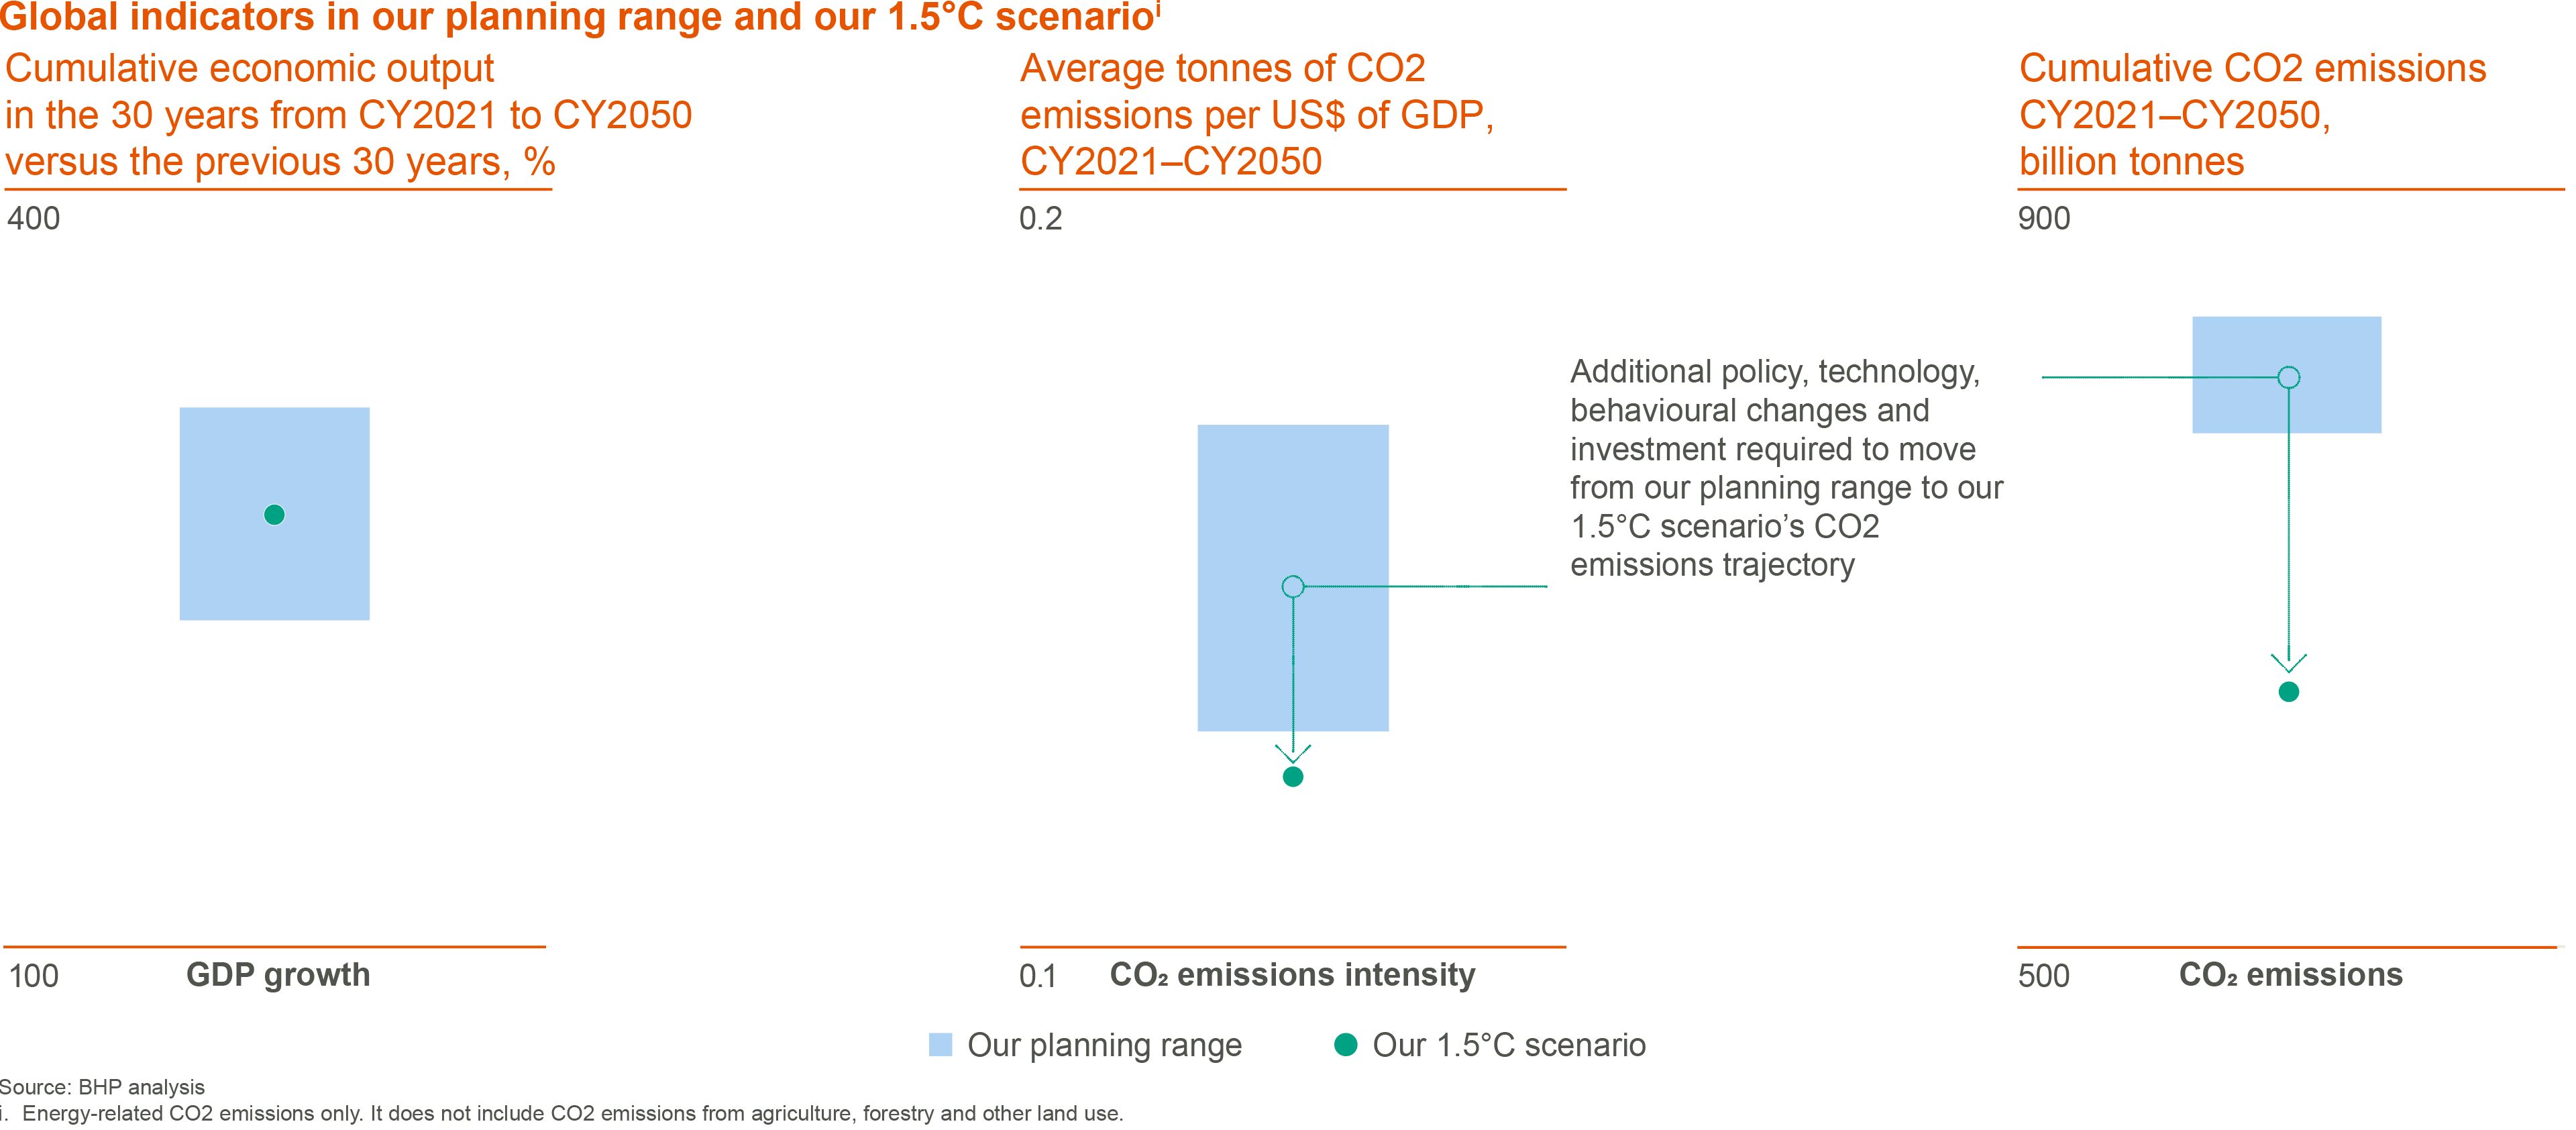
Our 1.5°C scenario charts one of many potential pathways in which future greenhouse gas (GHG) emissions are constrained within a carbon budget that is aligned to scenarios from the Intergovernmental Panel on Climate Change which limit global average temperature increase to 1.5°C by CY2100.1 Our 1.5°C scenario uses aggressive assumptions around political, technological and behavioural change, particularly for hard-to-abate sectors, such as steel. We believe it is unlikely this pathway will play out because of current trends and global efforts to date to address climate change.
We use our 1.5°C scenario in two distinct ways. First, we use it to derive commodity price sensitivities to assess potential impacts on portfolio value compared with our base case valuations using our planning range. Second, we consider our 1.5°C scenario as a sensitivity in capital allocation processes, which compares the demand outlook for our products in the planning range to that of a rapidly decarbonising global economy, should that eventuate.

Resilience in our 1.5°C scenario
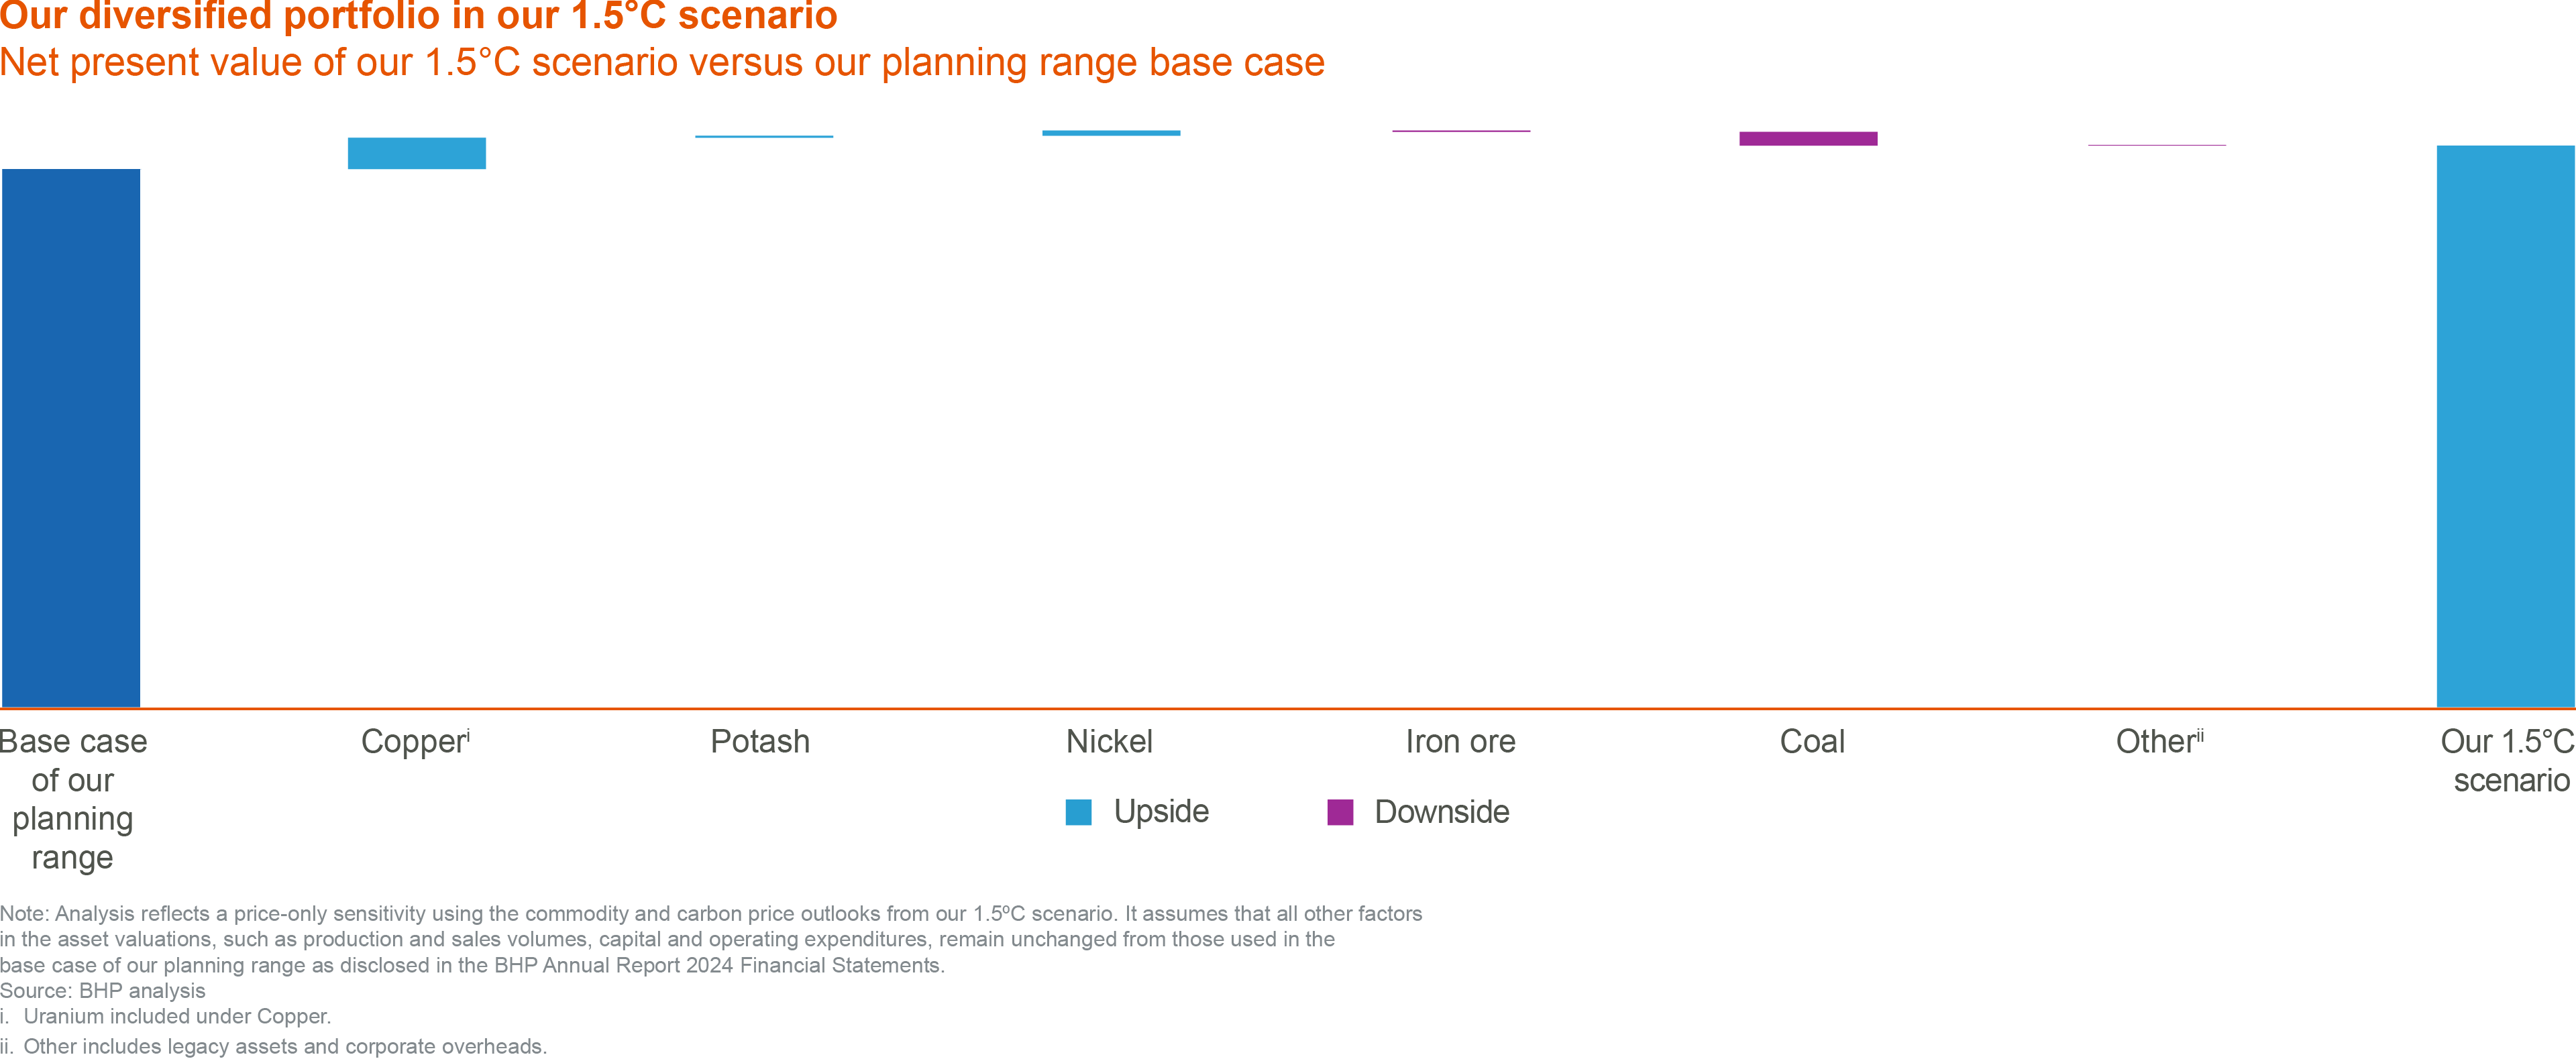
Our portfolio remains resilient under our 1.5°C scenario. The net present value of our portfolio under our 1.5°C scenario is approximately the same as under the current base case of our planning range, indicating we would be resilient in an accelerated transition to a 1.5°C outcome.
The impact of our 1.5°C scenario is different on each of our commodities. The value of our copper, potash and nickel assets increases relative to our base case, and offsets the effect to our portfolio from some downside risk to steelmaking coal.

In order to test the resilience of our steelmaking commodities, we have assumed an aggressive decarbonisation pathway for the steel sector in our 1.5°C scenario, which sets a trajectory for the sector that we see as unlikely to occur at this pace. The pathway for the steel sector in our 1.5°C scenario is far from what we see unfolding today, and it diverges significantly from the base case of our planning range.
Western Australia Nickel’s temporary suspension has not altered our scenario analysis, which includes nickel in our portfolio.
Based on current trends, it is unlikely our 1.5°C scenario will play out, however different elements of the scenario may be more or less likely. For our 1.5°C scenario to eventuate, it would require every sector of the economy to transform to net zero or net negative or, in the case of hard-to-abate sectors, to otherwise deeply decarbonise by CY2050. In some sectors, such as power and light duty transport, there are one or more clear pathways for such a transition, albeit challenging ones. However, some hard-to-abate sectors, such as the steel sector, require much larger technological, political and behavioural shifts from today's settings to achieve this end state.
We regularly monitor signposts related to decarbonisation and the energy transition and incorporate them into our annual planning processes and asset strategies.
Individual commodity assumptions and insights are provided in our CTAP 2024.
Development of our 1.5°C scenario
Our 1.5°C scenario was developed in-house in FY2024 and incorporates analysis and insights gained from regular signpost tracking and engagements with customers and suppliers, along with top-down modelling typically used in publicly available scenarios.
The outcomes from the analysis reflect faster technology ramp-ups in sectors that have already seen strong signals indicating that a particular technology will be favoured (such as rapidly growing penetration of wind and solar in stationary power and electric vehicles in the road transport sector). In sectors where fewer decarbonisation signposts have progressed to date, such as in steel, technology preferences are aligned to regional circumstances, including information around availability of resources, age of existing capital stock, access to low to zero GHG emission electricity, current levels of policy support and relative economic development. Some of the assumptions made lead to different outcomes by CY2050 between our 1.5°C scenario and other publicly available scenarios. Our 1.5°C scenario models transition risks from now to CY2050, but does not explicitly incorporate the potential impacts of physical climate-related risks.
Our new scenario differs from our CY2020 1.5°C scenario, which relies more extensively on top-down modelling of the global energy system. Given the higher cost of decarbonising hard-to-abate sectors, the top-down modelling leads to heavy industrial sectors, such as steel, utilising more land-based CO2 removal credits. In our CY2020 1.5°C scenario, the heavy industrial sectors also relied more extensively on carbon capture utilisation and storage to decarbonise, relative to higher-cost hydrogen-based and electrification technologies.
To establish commodity demand, we conducted top-down modelling using The Integrated MARKAL-EFOM System partial equilibrium energy system model. We complemented this with bottom-up modelling for key sectors (steel, transport, power, and agriculture) to incorporate regional pathways differentiated by resource endowments, policy and technology. We used the Model for the Assessment of Greenhouse Gas Induced Climate Change to test alignment with a 1.5°C carbon budget and the Model of Agricultural Production and its Impact on the Environment model land-use change. Comparisons of cumulative demand use the 30-year period from CY2021 to CY2050 against the preceding 30-year period CY1990 to CY2019 (unchanged from our CY2020 1.5°C scenario) as the scenario only forecasts out to CY2050.
We considered the key assumptions from this work, including carbon price projections and changes in demand for different commodities, in revised BHP supply models for each commodity. This was combined with demand to determine future prices under our 1.5°C scenario.
Approaches to scenario analysis continue to evolve, with an increasing number of external scenarios becoming available as reference points for the full range of commodities we produce. Recognising this, and the increasing maturity of those external scenarios, in future years we plan to transition to the use of externally-developed 1.5°C scenarios, where appropriate, to derive commodity price sensitivities to inform resilience testing of our portfolio and to consider as a sensitivity in capital allocation processes. 1.5°C scenarios are inherently ambitious and currently have a low likelihood of eventuating, therefore we will be able to draw more useful insights from a broader range of 1.5°C scenario versions than only our own.
Our 1.5°C scenario’s key assumptions, carbon budget and carbon prices; the key metrics for our 1.5°C scenario compared with our CY2020 1.5°C scenario and other third-party scenarios; and the signposts we monitor are provided in our CTAP 2024.
1. Pathways giving at least 50 per cent probability based on current knowledge of limiting global warming to below 1.5°C are classified as ‘no overshoot’. Page 24 of Summary for Policymakers. In: Global Warming of 1.5°C. IPCC, CY2018. GHG emissions in our 1.5°C scenario are constrained to a carbon budget of 500Gt CO2-e (on a net GHG emissions basis) between CY2020 and CY2050, and is modelled to have a global warming trajectory that temporarily overshoots 1.5°C before returning to below 1.5°C by CY2100, on the basis of the median of probabilities.
Sustainability case studies, organisational boundary, definitions & disclaimers, and downloads
Prior year versions of some of the listed documents are available on the Past reports page.-
BHP Annual Report 2024
pdf
16192519

-
BHP Climate Transition Action Plan 2024
pdf
8480121

-
Sustainability reporting organisational boundary, definitions and disclaimers
pdf
161998

-
Límite organizativo de los informes de sostenibilidad, definiciones y cláusulas de exención de responsabilidad
pdf
6277

-
BHP ESG Standards and Databook 2024
xlsx
2555913

-
CDP 2023 Submission Not Graded
pdf
1053064

-
BHP Climate Transition Action Plan 2021
pdf
2677572

-
BHP Climate Change Report 2020
pdf
3112031

-
Climate Change: Portfolio Analysis View after Paris
pdf
3001458

-
BHP GHG Emissions Calculation Methodology 2024
pdf
1028031

-
Case studies

