
The electrification of transport: episode one

One of the mega-trends expected to shape our long run operating environment is the electrification of transport.
This is the first episode in a series on this vital topic.
It is two and a half years since we inaugurated this blog site by publishing our bullish outlook for electric vehicles (EVs). At the time, there were very few forecasts in the public domain. Those that were available described a bi-modal range: either dismissive or ebullient. There was little in between.
Much has changed since that time. The space is now “crowded” with forecasters1. Indeed, we observe something resembling a game of leapfrog as various institutions fight to be perceived as more bullish than their counterparts.
As for ourselves, we have made one fundamental change since our initial release. We have raised our low case for EV market share.
Why even mention a change in the low case, if our expected case is still on schedule? As highlighted at our Capital Allocation Day, we do not make decisions based on mid-case forecasts. We think, instead, in plausible ranges. Low cases take on especial importance in our framework. The likelihood of achieving positive expected returns, scaled for risk, in a low case operating environment is one of the critical metrics for any investment that seeks to advance in our internal process.
Our EV cases, consistently applied across the portfolio, are essential to establishing the plausibility of our long run copper, nickel, oil and power demand ranges. That is turn flows into price estimates and our assessments of the relative attractiveness of commodities inside and outside our portfolio.
So, what are our cases?
First of all, it is important to define exactly what we mean by EVs. EVs are the sum of wholly battery powered vehicles and plug-in hybrid vehicles. Traditional hybrids like the Toyota Prius are not captured in this category.2
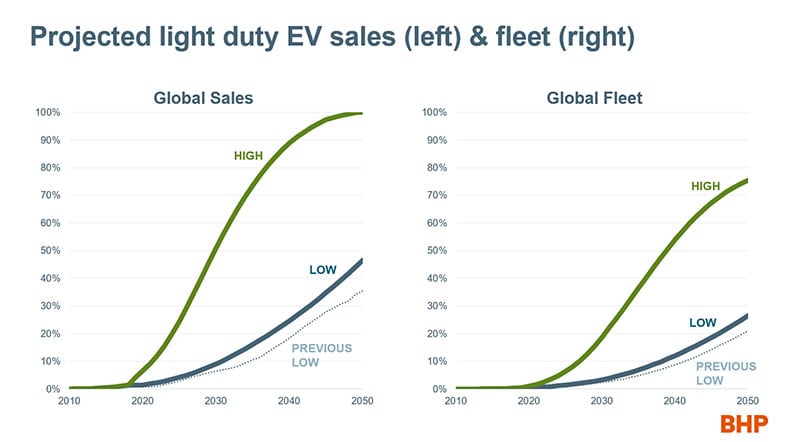
In 2035 and 2050 respectively, we now see the lowest plausible rate of EV penetration in the light vehicle fleet (i.e. vehicles on the road) as 7 per cent (previously 5 per cent) and 27 per cent (previously 21 per cent). We see the highest plausible penetration rates at these two points as 36% and 75%.
The associated share of light vehicles sales in those years are 16% (previously 10 per cent) and 47% (previously 35 per cent) in the low case and 73% and 100% in the high case.
To convert those market shares into auto units, in the low case we envisage there will be 132 million EVs on the road in 2035 and 561 million at mid-century.
In the high case, the EV fleet is expected to surpass 700 million by 2035 and reach 1.6 billion by 2050.
Naturally, the low and high case market shares do not share the same denominator. One of our more important end-use assumptions is the size of the total light duty fleet, and the production (where and when) required to keep it at the required level to deliver estimated future transport services.
In the low case, in 2035, we expect the total light duty fleet will reach 1.68 billion units. We expect 2.26 billion in the high. In 2050, the gap is even wider: 1.79 billion versus 2.5 billion.
Put simply, in the high case, EVs penetrate faster in a larger and more rapidly expanding market for vehicle ownership and transport services; in the low, they penetrate more slowly in a smaller and less rapidly expanding market for vehicle ownership and transport services. Hence the impact on demand for materials to build and power that fleet, such as copper, is very different indeed, as is the rate of displacement for those materials, such as crude oil, involved in powering traditional vehicles.
How did we arrive at these forecasts?
Our view on EVs is one of the hundreds of common assumptions and end-use forecasts that we compile to assemble an internally consistent, bottom up view of the world, and by extension, the demand for commodities. That process starts with demographics; extends to economic growth, geography and structure; drills down into sectoral and sub-sectoral detail; while taking account of technical factors such as substitutes, complements, scrap, replacement cycles and time-varying manufacturing intensities of use; as well as qualitative factors such as policy and evolving consumer preferences.3 Where EVs specifically are concerned, over-laid on all of that is a bespoke framework for projecting rates of technological change.
We first introduced that framework to readers of Prospects by comparing the historical rise of smart phones to the prospective rise of EVs. To recap, once an emerging technology reaches a point where it has achieved a cost, performance or utility advantage over an incumbent technology4 (whichever is most relevant), this is what we need to come to a position on to project its diffusion rate:
- Are incumbent producers embracing the technology?
- What is the turnover rate or product lifecycle?
- Does the technology generate positive network effects?
- Does the technology require new infrastructure or does it leverage existing infrastructure?
With EVs, as we have not yet reached the point where the product is superior to internal combustion engine (hereafter ICE) vehicles, we must first project if and when we will reach the tipping point for mass market consumer preferences. The key parameters here are all battery related: full pack cost, range and charging.


