19 August 2025
Please refer to the Important Notice at the end of this article1
Resilience Amidst Uncertainty
The external environment in Fiscal Year 2025 was dominated by policy uncertainty, with tariffs, fiscal, monetary and industrial policy, shaping investment and trade flows. Despite these dynamics, demand for BHP’s commodities has been resilient and, in the case of copper, demand has been higher than previously expected.
Front-loaded exports, inventory buffers and targeted policy support, particularly in China, have cushioned the immediate impact of heightened uncertainty. In China, copper and steel have also benefited from a sharp acceleration in renewable energy investment, grid expansion and machinery and electric vehicle production.
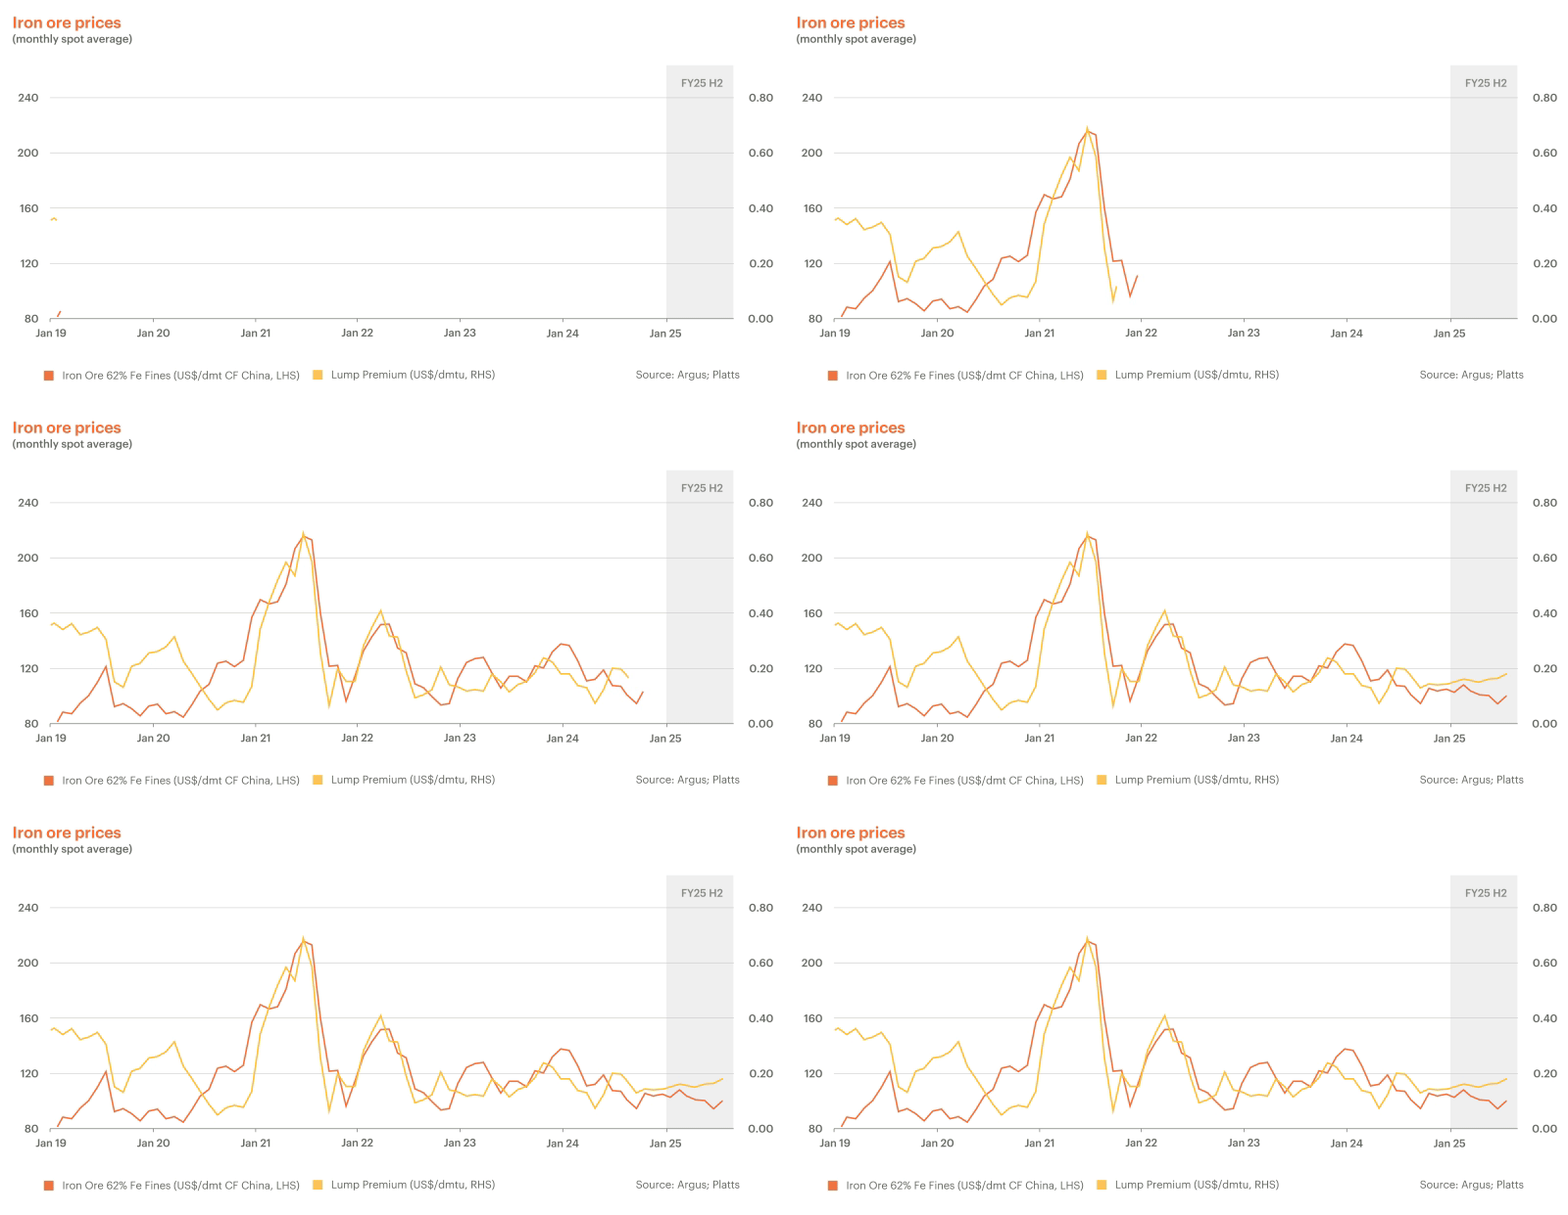
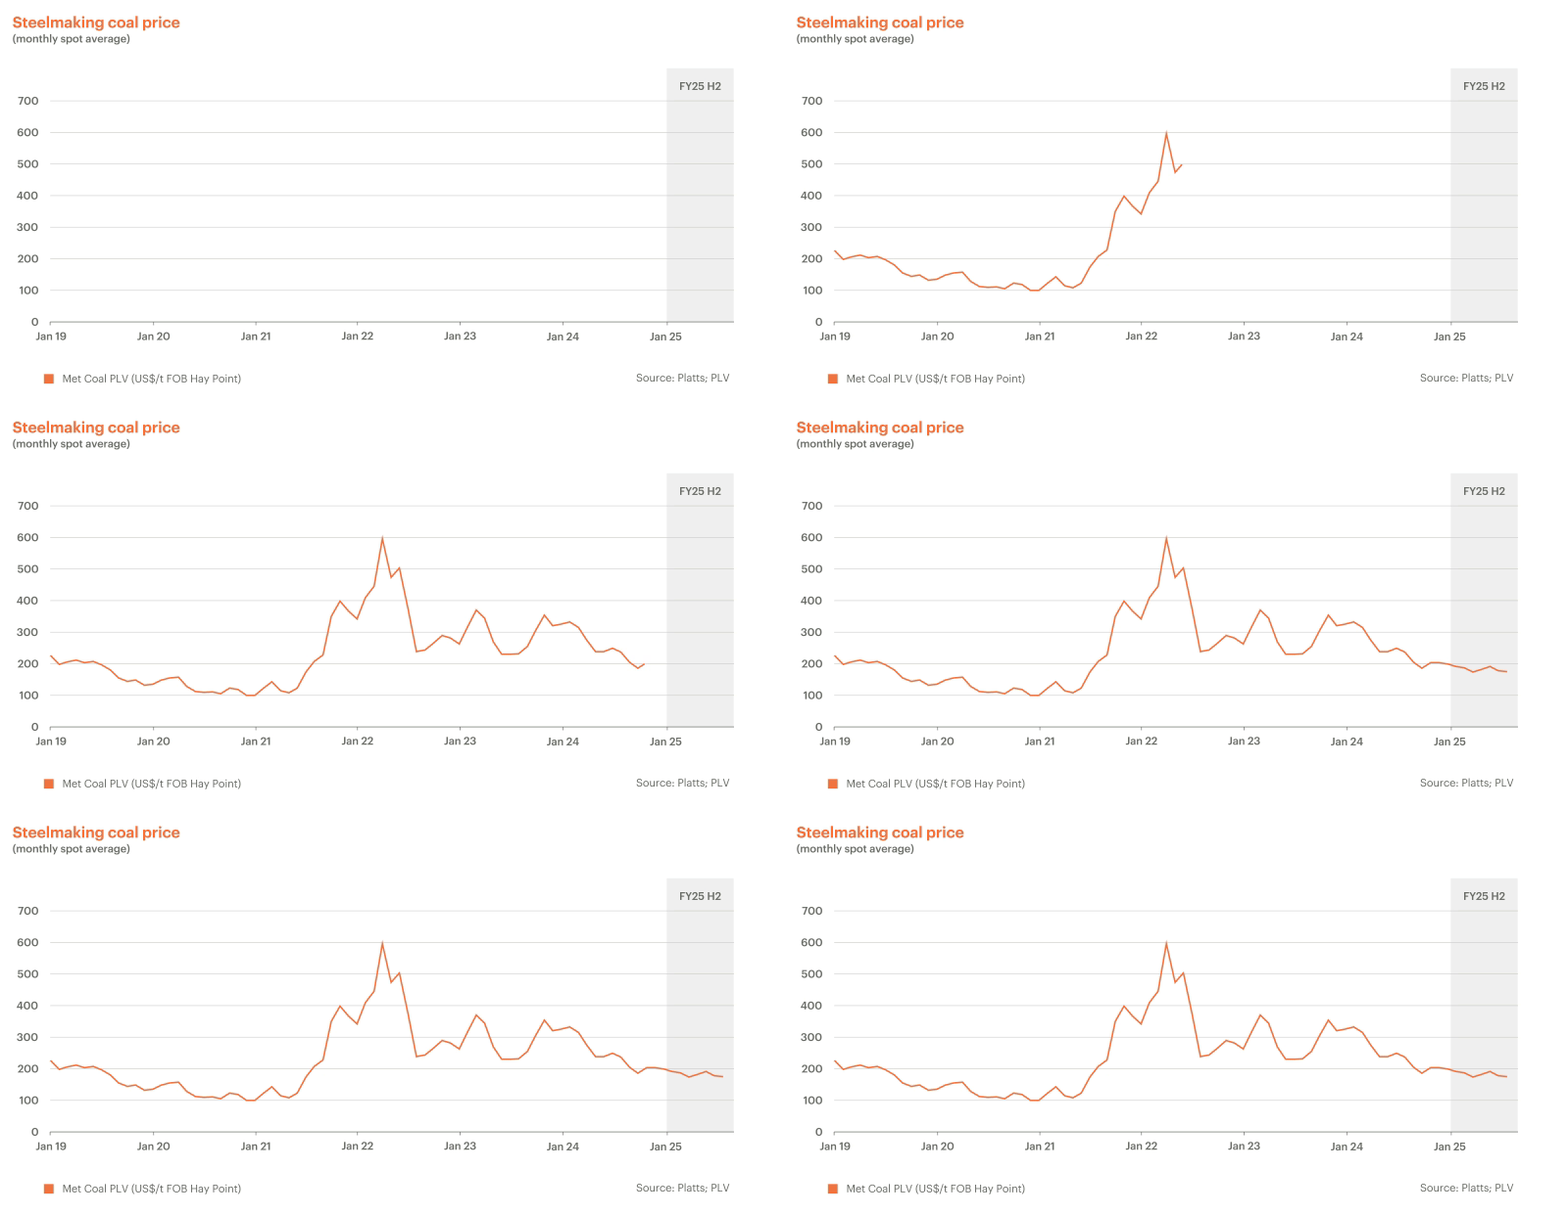
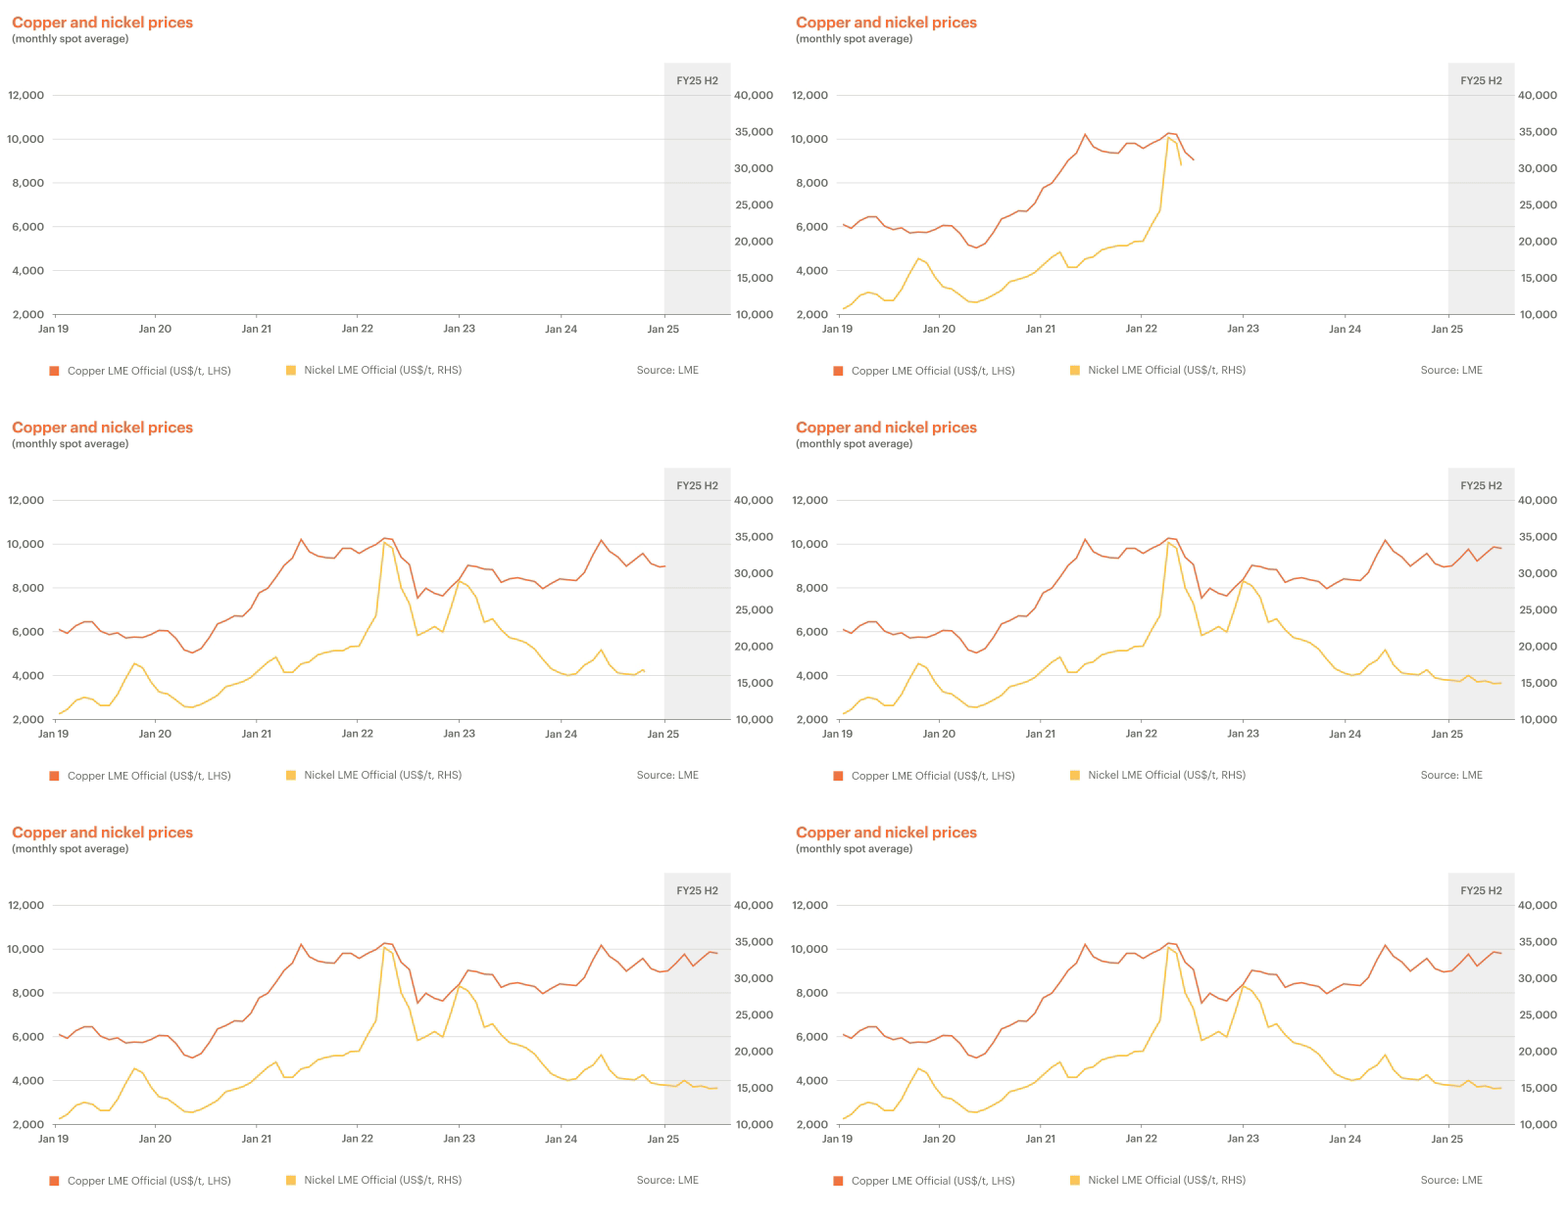
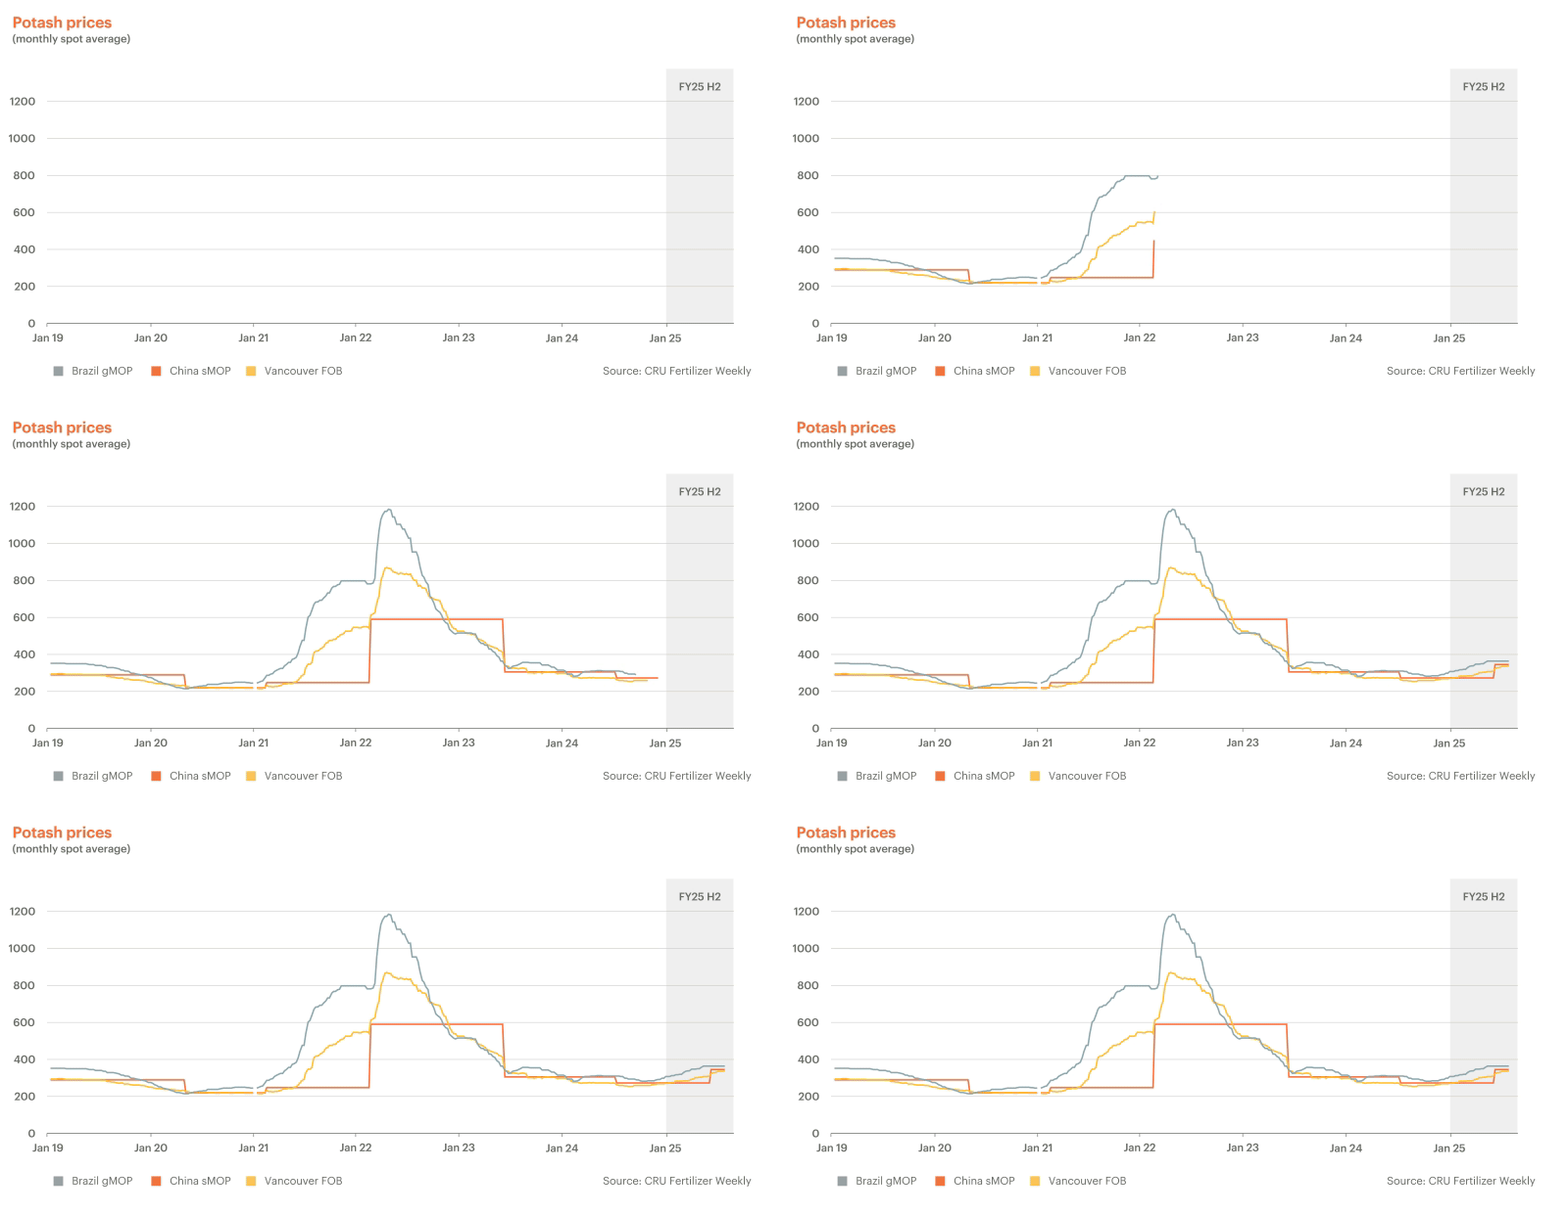
Commodity prices have been mixed. Copper prices were volatile but rising towards the end of the period. Steelmaking raw material prices ended the year below where they began, though iron ore has since rebounded close to its FY25 average, while potash prices have firmed.
We are mindful that macroeconomic volatility may increase in the near term as the world adjusts to the evolving global economic order. The International Monetary Fund (IMF) projects global growth to moderate to 3% in CY25, an upward revision from its April estimate of 2.8%, albeit slower than the CY24 outcome of 3.3%. This reflects ongoing trade policy shifts, with recent tariff outcomes proving less disruptive than when initially announced. Alongside this, calibrated stimulus in China and continued strength in India are expected to provide important support. Taking these dynamics into consideration, over the next year, we expect refined copper, uranium and potash markets to be roughly balanced, while steelmaking raw materials and nickel to be in surplus.
We do not see short-term macro volatility fundamentally altering our longer-term outlook. As policies stabilise, and trade flows adjust to the new dynamics, we continue to expect that population growth, urbanisation, rising living standards, and the infrastructure of digitalisation and decarbonisation will drive demand for steel, non-ferrous metals and fertilisers for decades to come. The need to increase supply chain resilience across multiple geographies together with strategic stockpiling could provide further upside to this outlook.
By the end of the decade, we continue to see copper pricing moving into a phase of durable outperformance.
Steelmaking raw materials are expected to enter an era of adjustment characterised by the crosscurrents of China’s crude steel plateau maturing, India and Southeast Asia’s steel capacity growth, and shifting supply driven by new market entrants and a depleting resource base. China’s manufacturing competitiveness, particularly in machinery, electric vehicles and new energy technologies, remains a key support for metals demand. Meanwhile, we expect potash demand to continue to benefit from a rising population, improved living standards and changing diets.
Enduring Demand in a Changing World
By 2050, the world’s population is expected to approach 10 billion, with more than half residing in Asia. This will require vast investments in housing, schools, hospitals, road and rail infrastructure and electrification, which are all resource intensive. Urbanisation alone is projected to add around 1 billion people to the world’s cities, where steel and copper intensity is significantly higher than in rural areas. Copper’s role in wiring, plumbing and communications infrastructure makes it a critical enabler of this transition.
Rising incomes across emerging economies are set to further multiply demand. As households gain access to modern housing, appliances and vehicles, consumption of steel and metals rises in tandem. At the same time, the digital economy, from data centres and telecommunications networks to smart cities and industrial automation, is expected to accelerate demand for copper and steel-intensive technologies.
Even geopolitical fragmentation and trade realignment, while disruptive, are likely to reinforce demand in some areas. The push to build more resilient, regionalised supply chains is expected to drive investment in infrastructure, reshored manufacturing, and strategic stockpiles, all of which place upward pressure on commodity demand.
Our strong balance sheet positions us not just to weather the volatile world we face today, but also to take advantage of opportunities as they arise well into the future.
China
China’s economic growth exceeded expectations through the first half of CY25, with real GDP growth of 5.3% year-on-year (YoY), tracking ahead of the government’s full-year target of around 5%. Growth was supported by strong export activity, trade diversification and a notable lift in public spending. While exports to the US declined, China’s competitiveness in key sectors such as electric vehicles and machinery helped sustain overall trade momentum.
Beneath headline growth, the performance of commodity end-use sectors in China continues to vary. While the property sector remains weak, new housing starts and completions are contracting at a slower pace than in CY24. China’s most populous cities have shown early signs of stabilisation, while lower-tier markets continue to face headwinds.
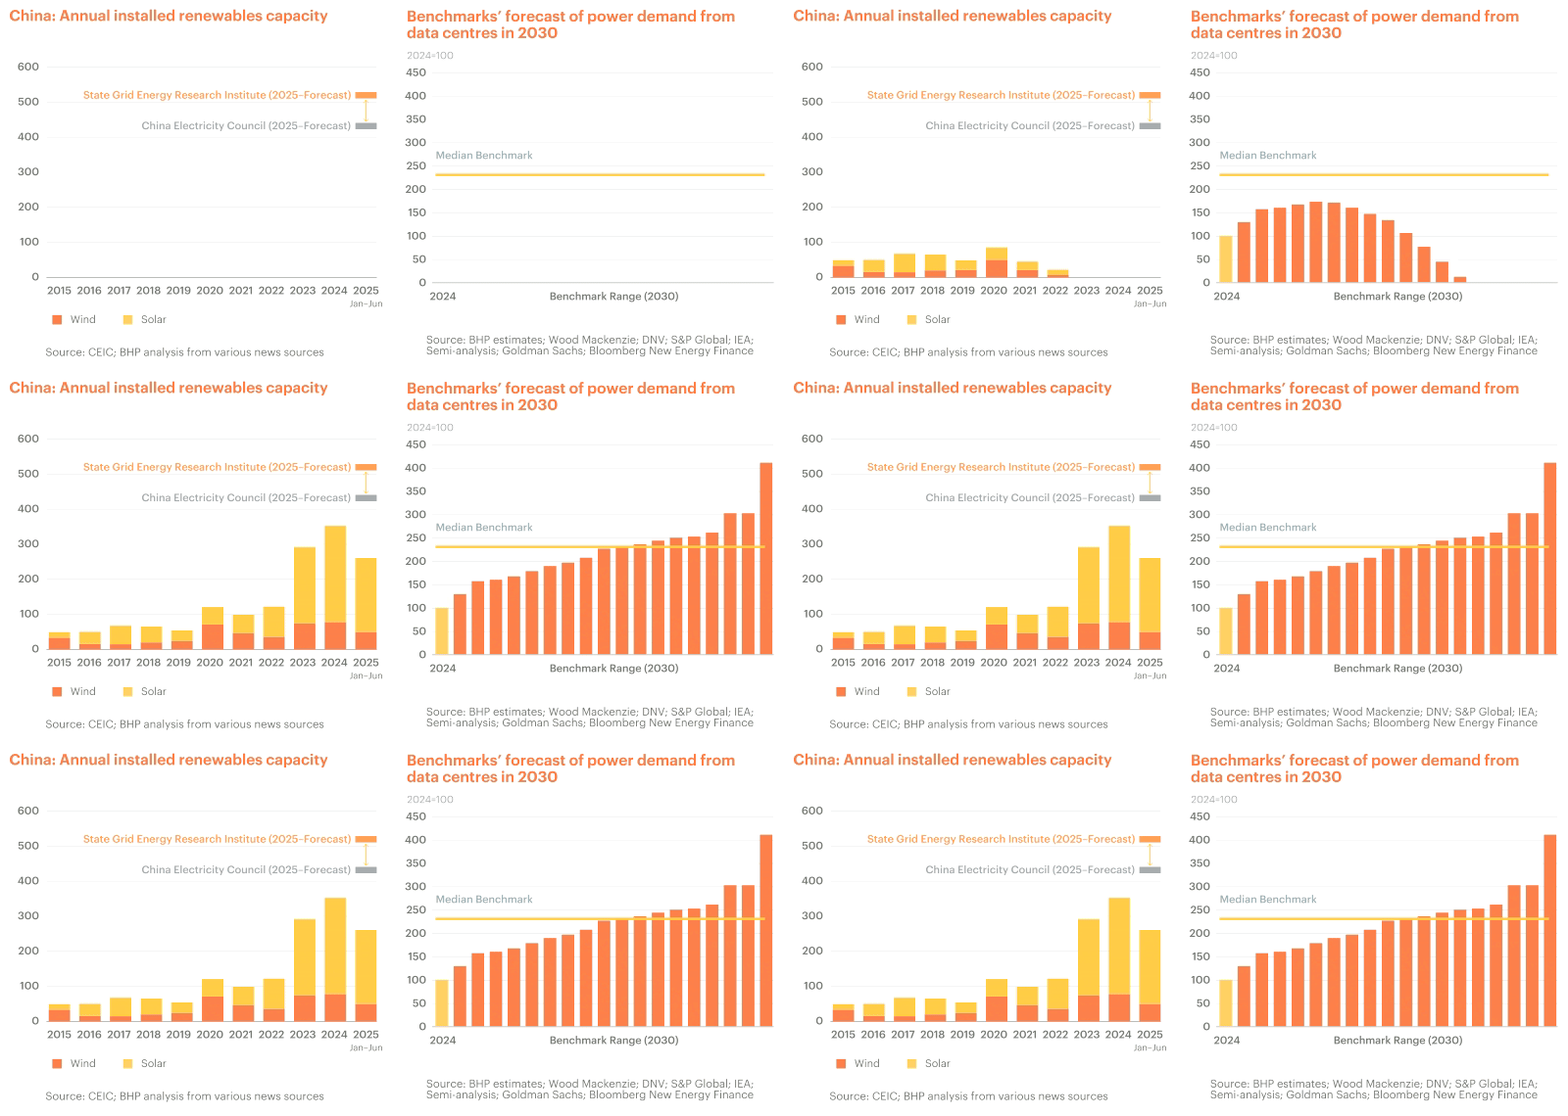
In contrast, sectors linked to lower greenhouse gas (GHG) emission2 energy and electrification have been a genuine bright spot. Grid investment rose by +15% YoY in H1 CY25, supporting the rapid build-out of wind and solar capacity. China added 264 GW of renewable capacity in the first half of the year alone — equivalent to around 90% of all wind and solar ever installed in the United States. While some moderation is expected in the second half, full-year additions are still likely to be historically strong. Electric vehicle production also surged, with sales penetration on track to exceed 50% of all light-duty vehicles in the country in CY25.
These trends have provided a strong tailwind for copper demand.
Consumer-facing sectors have also benefited from targeted policy support. Subsidies under the “consumer goods trade-in” program and equipment upgrade initiatives have helped bolster demand, especially for copper end-use sectors such as consumer durables and electronic goods sold domestically. For example, retail sales of household electric and video appliances grew by +31% YoY in H1 CY25.
Looking ahead, China's growth could slow in the coming quarters from this high base, as the boost from earlier exports unwinds and the pace of public spending moderates. However, the cost competitiveness of Chinese goods that accumulated in recent years, particularly while other countries faced significant inflation, means China’s exports will likely remain relatively resilient. China also retains policy flexibility, and recent infrastructure announcements suggest a willingness to lean on investment if needed. At the same time, high-level policy signals continue to emphasise “quality growth,” with a focus on productivity, demographic challenges and industrial upgrading.
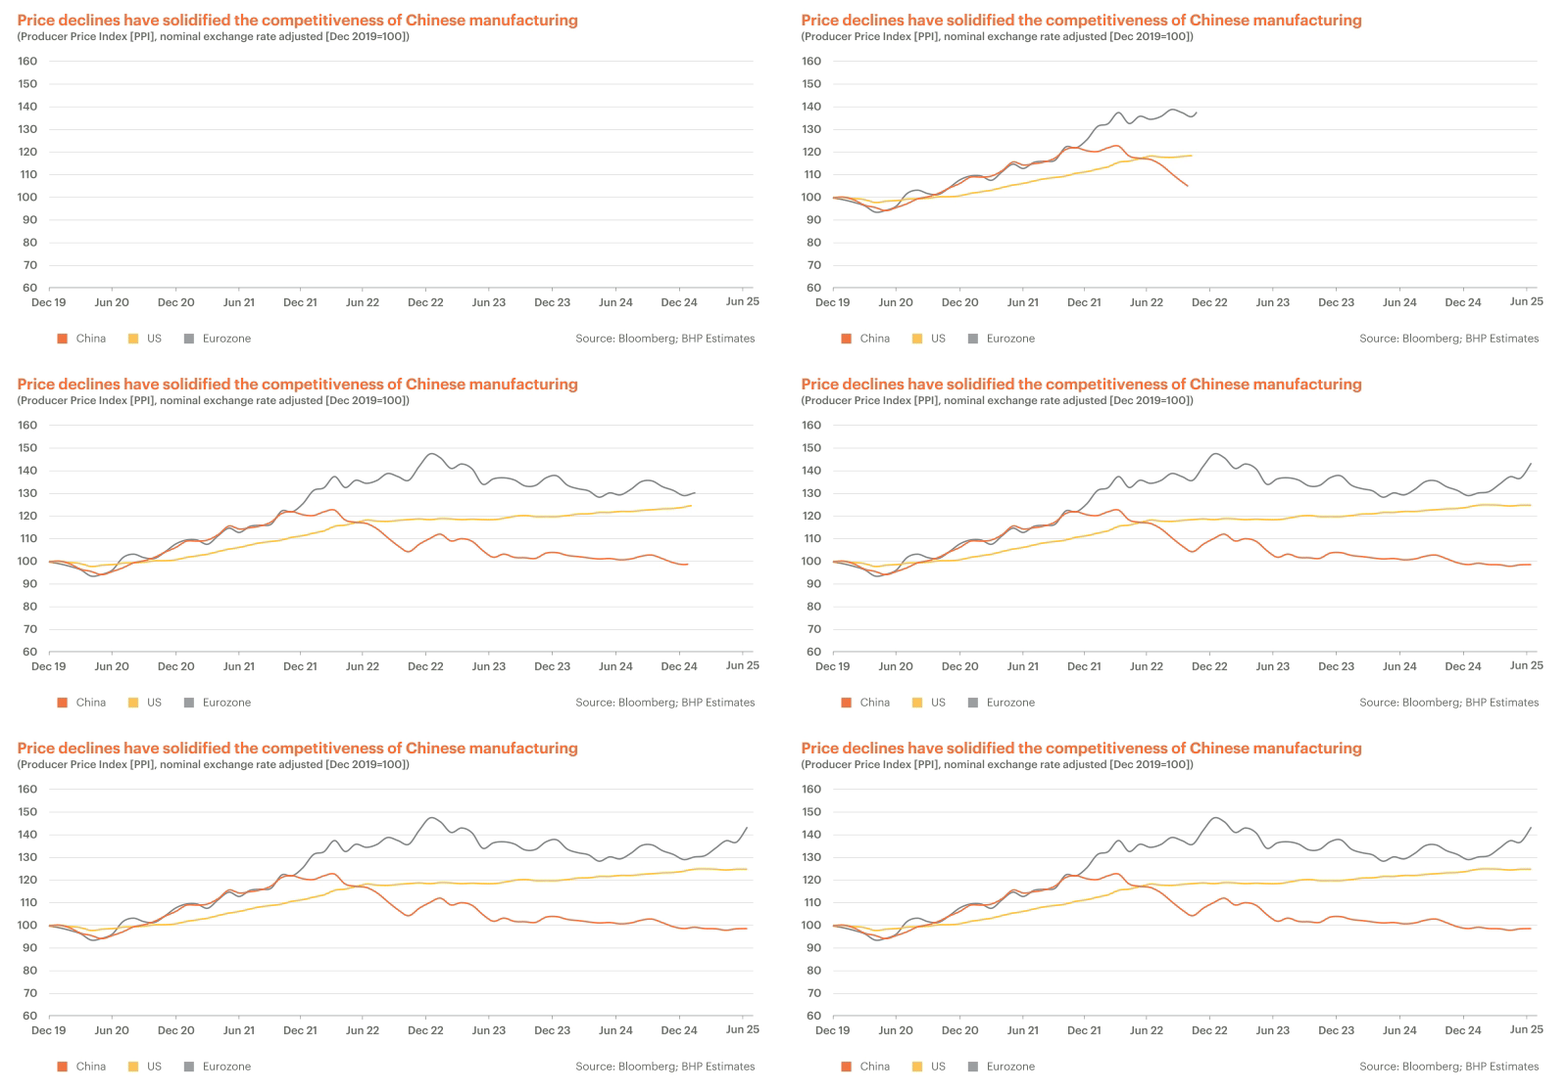
Over the longer term, China’s growth is expected to moderate as its population ages, fiscal capacity becomes constrained and capital stock matures, with a gradual rebalancing of activity likely to occur from investment and exports toward consumption and services.
However, China’s strong and consistent investment in decarbonisation technology production, complemented by high rates of adoption internally, imply it will remain an opportunity rich market for commodities for many decades to come.
India
India continues to stand out as the fastest-growing major economy, with momentum underpinned by strong domestic demand, favourable demographics, and rising investment. According to the IMF, India is on track to become the world’s fourth-largest economy by the end of CY25, surpassing Japan, and is projected to reach $5 trillion in GDP by CY27. By CY28, it is expected to overtake Germany as the third-largest.
While recent US tariff developments present a risk, India’s relatively modest trade exposure to the US helps contain the potential impact. Goods exports to the US account for just 2.2% of India’s GDP, and when excluding imported content and sectors not subject to tariffs, GDP exposure is 1.1%. The country’s commodity consumption is also largely domestically-focused, with almost all steel production consumed in the country (net steel exports averaged 2% of Indian steel production over the last decade). Combined with the government’s capacity to deliver targeted support to affected industries, these factors support a constructive outlook for Indian commodity demand.
India, along with other parts of developing Asia, are in the early stages of a long structural growth cycle, partly underpinned by regional trade integration. A young and growing population, rapid urbanisation, and rising incomes are expected to drive sustained demand for steel, copper, and other industrial commodities for decades to come. For example, India’s copper demand per capita today is only 1/8th that of China and advanced economies.
As infrastructure investment accelerates and manufacturing expands, the region’s metals intensity is likely to rise sharply.
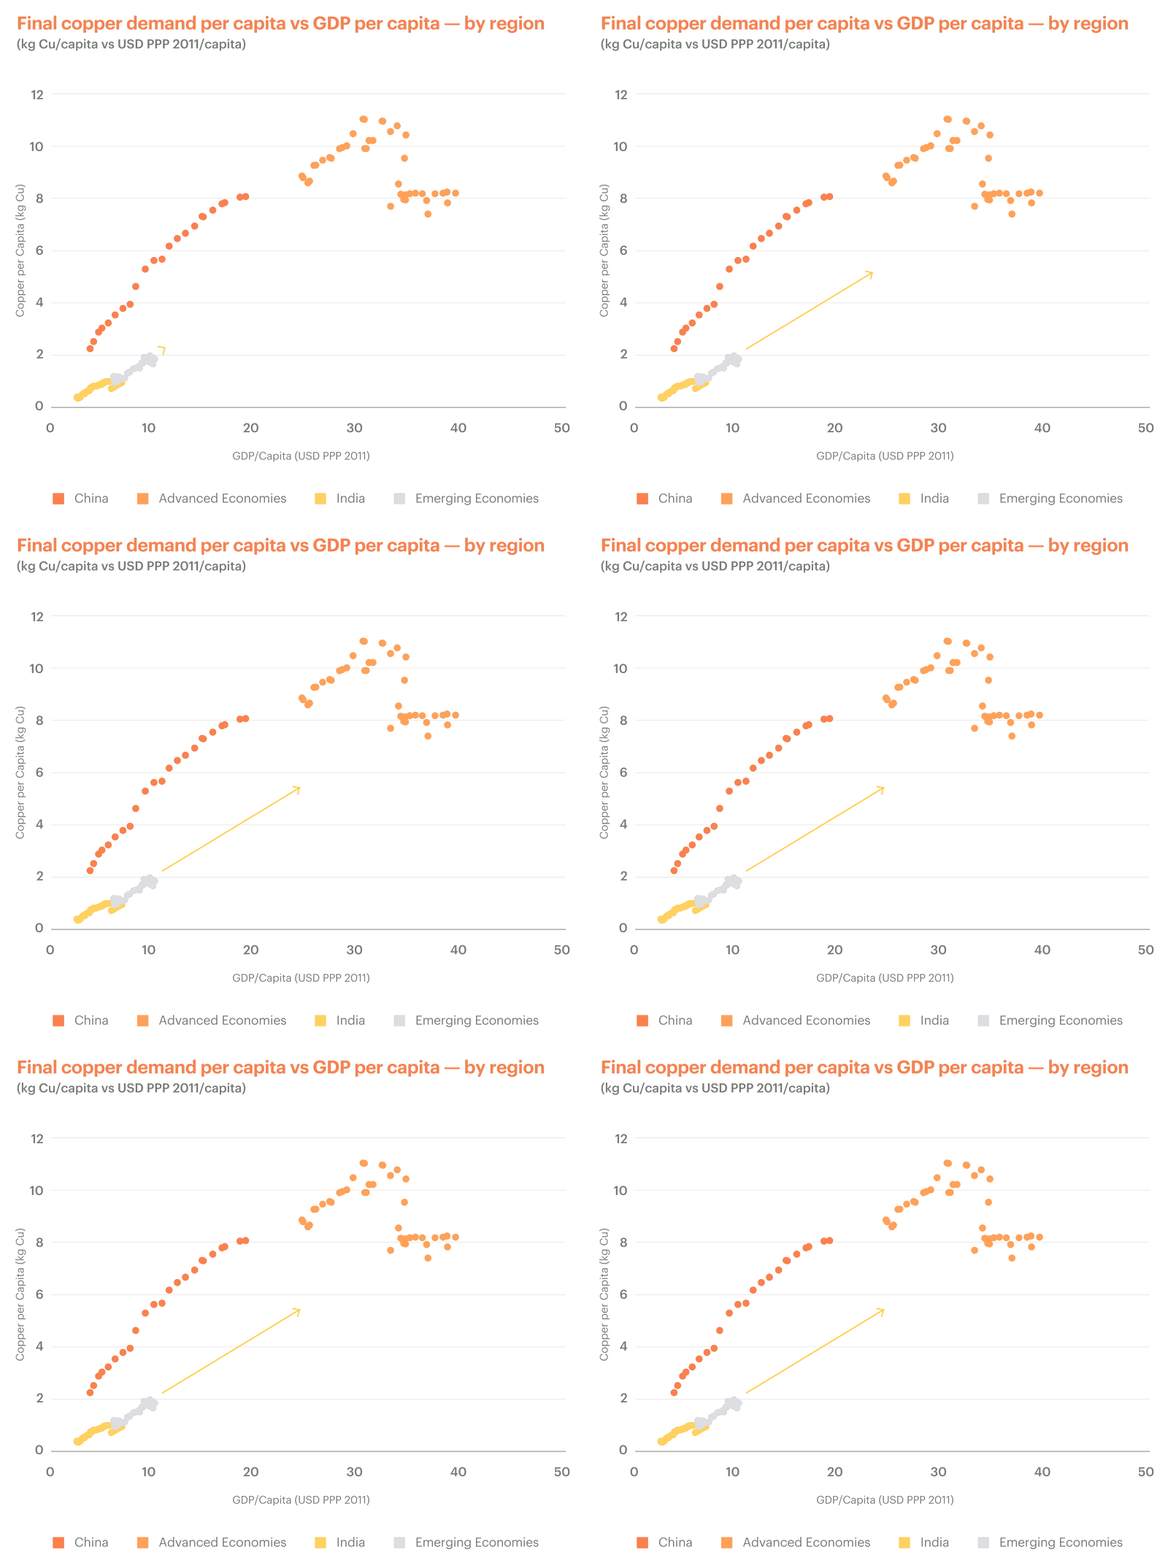
India’s competitive cost base, abundant labour, large-scale infrastructure ambitions and growing potential to capture export markets as global supply chains evolve, continue to attract both domestic and foreign investment. These dynamics are expected to reinforce long-term demand for construction materials, transport networks, energy systems and industrial capacity, all of which are resource-intensive and aligned with BHP’s portfolio.
Long-term megatrends bearing fruit
Some of the emerging megatrends that we have been signalling for some time are also starting to bear fruit. Copper will be the biggest beneficiary of the energy transition and the digitalisation trends starting to take shape, though steel, nickel and uranium demand could also see upside. These unfolding structural shifts should provide a commodity demand buffer against potential upcoming macroeconomic headwinds, with momentum building towards the end of the decade.
China’s recent new energy technology push has been significant: the country met its 2030 wind and solar capacity target six years early in CY24; light-duty electric vehicle production (both for domestic sales and exports) has been growing at pace, with two in three electric vehicles sold globally now made in China ; and a record level of grid investment by State Grid Corporation of China is expected in CY25 (CNY650 billion vs CNY600 billon in CY24, which was also a record). We anticipate this momentum to continue, albeit with some potential intra-year volatility as policy schemes shift. China’s push towards leadership in these sectors is also causing significant price deflation for technology exports, which has and will continue to create additional near-term demand in cost-conscious export markets. For example, in Southeast Asia, rising Chinese imports enabled electric vehicle penetration to double YoY in H1 CY25, with over 20% of cars sold being electric as of May 2025.
Recent energy transition spend has continued to grow in the rest of the world too, with the International Energy Agency (IEA) projecting advanced economies to surpass $1 trillion of “clean energy investment” (the IEA’s term) for the first time in CY25 (+7% YoY). Nevertheless, policy changes in some advanced economies, such as the roll-back of US Inflation Reduction Act subsidies and the weakening of the EU’s near-term carbon dioxide emissions standards for carmakers, are likely to create some risks to the near-term electrification outlook. Electric vehicle sales in OECD countries have already shown signs of slowdown, with the US and Japan ‘only’ recording low single digit growth in H1 CY25, in contrast to the high double digits of the recent past. The EU also experienced flat electric vehicle sales in CY24, albeit with a stronger pick-up over the last six months. We view this as a cyclical slowdown for advanced economies, rather than a structural shift. Scale-driven electric vehicle price declines, the launch of fresh models and the eventual strengthening of policy support should offer tailwinds for growth in the latter part of the decade.
Our assessments also show that near-term weakness in ex-China electrification could be partially offset by higher-than-expected power demand growth from data centres and digitalisation. In its latest base case forecast, the IEA projects installed data centre capacity to grow by 2.3x by 2030, with almost 60% of capacity based in Europe and North America—both regions that have seen a deceleration in energy transition spend. Nevertheless, we acknowledge that uncertainty in the digitalisation space is significant.
Benchmarks vary drastically even out to 2030, with various forecasters projecting power demand from data centres to grow by as much as one to four times today’s levels. Our estimate is closer to the middle part of that range, but if the high end is correct, that could mean adding slightly less than India’s annual power consumption in data centres over the next five years.
Commodity Deep Dives
Steel and pig iron
Global steel production was resilient in H1 CY25, with steady production in China and growing production in India offsetting weakness in Europe and Asian advanced economies. Chinese steel demand was supported by government-led infrastructure projects, robust manufacturing and transport sector end-use, including front-loaded exports ahead of trade barriers ramping up. China’s direct steel exports were also strong, driven by competitive pricing and early order placements. These factors continued to offset ongoing weakness in the property sector.
While downside risks may emerge as the macro environment develops, policy support is expected to remain a key lever to support downstream demand. Fiscal outlays for infrastructure (as demonstrated by the recent announcement of the Tibet dam investment project, which is projected to add 11 million tonnes (Mt) of steel demand over the project’s construction), and improving domestic demand, should act as a counterweight to ongoing weakness in the property sector and risks that may emerge in the external sector.
CY24 was the sixth year in a row of China producing more than one billion tonnes of steel, and we maintain our view that China will remain in a plateau phase around that mark through the mid to late 2020s. Nevertheless, pig iron production is expected to decline as China’s capital stock matures, scrap usage increases with greater scrap availability, and as more policy is enacted to reduce energy consumption and GHG emissions.
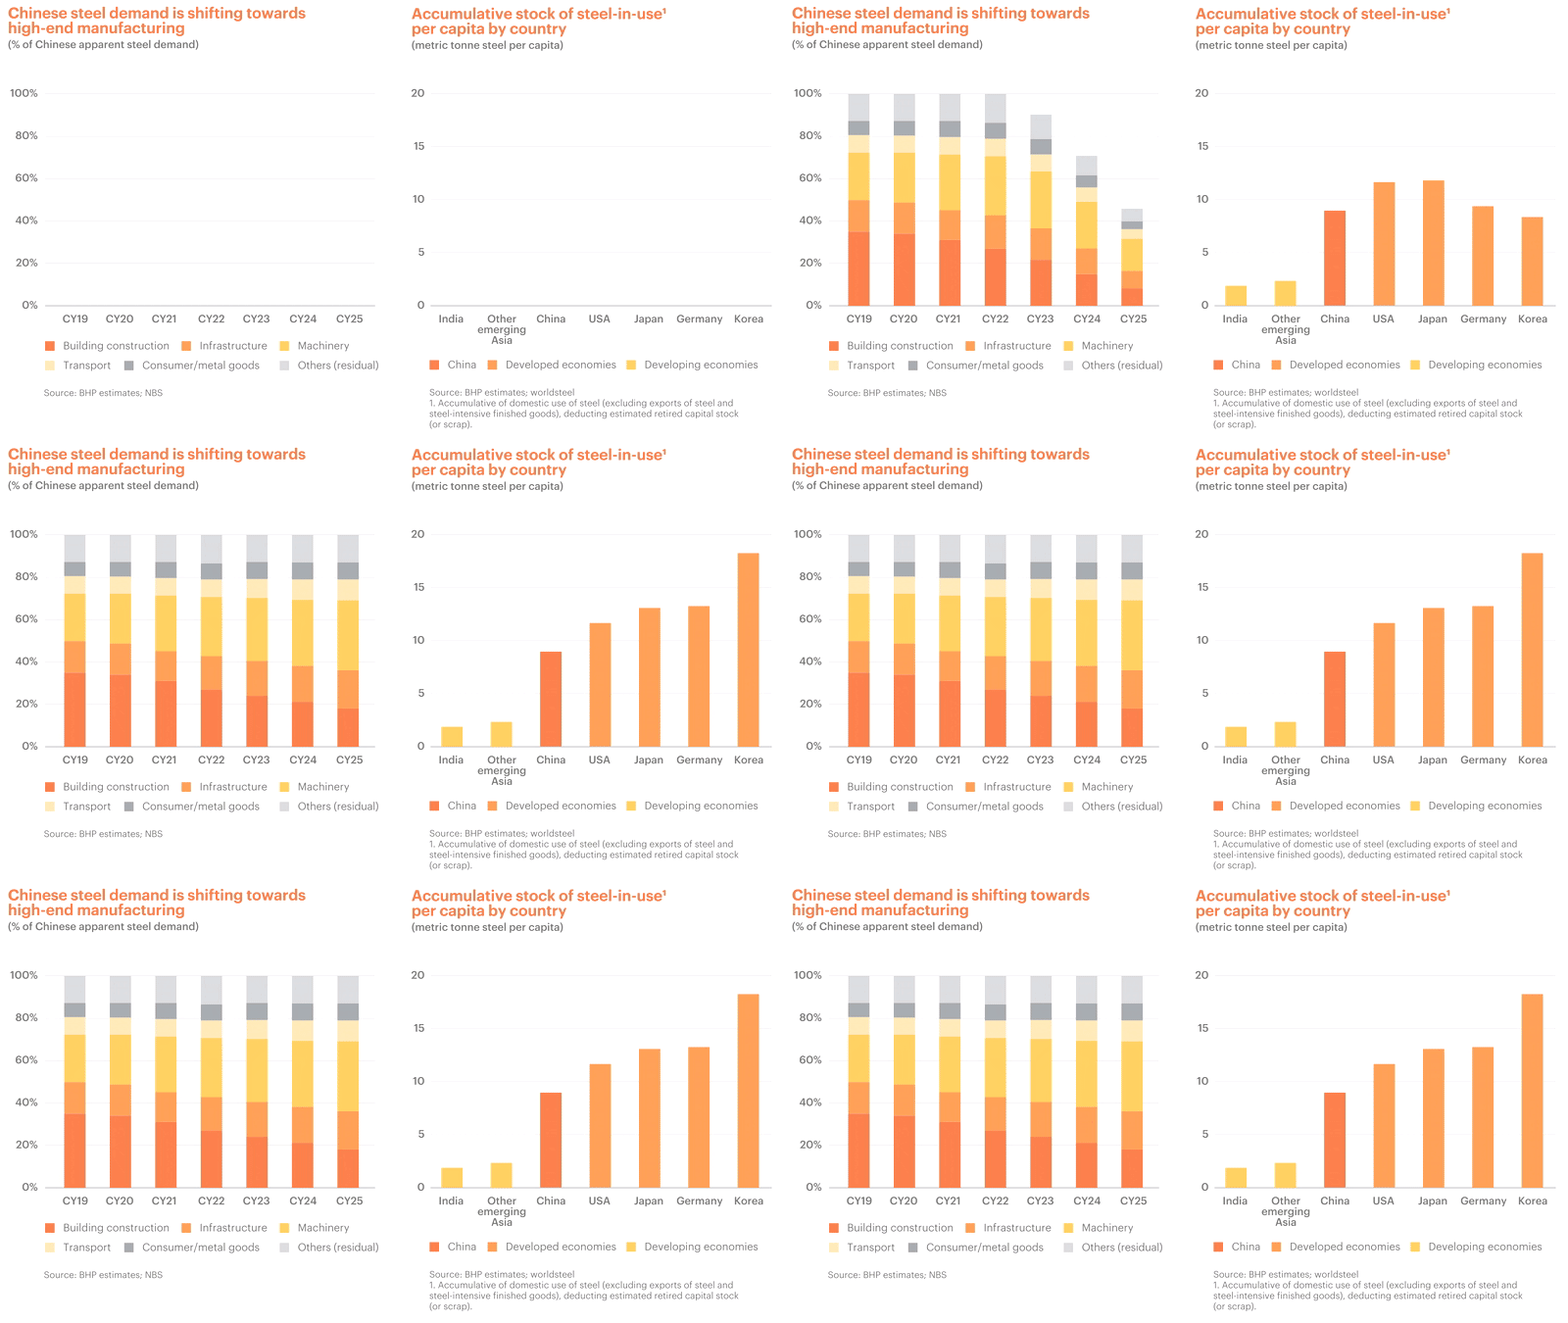
Turning to the long term, we expect China to continue to increase its accumulated stock of steel-in-use, which is about 9-10 tonnes per capita and still well below the current US level of around 11-12 tonnes per capita.
China’s economic model, which is more steel-intensive than that of the US, and the continued build-out of high-speed rail, urban metro-rail and ultra-high voltage transmission power lines, could mean that steel-in-use grows closer to the average currently seen in Germany, South Korea and Japan.
India is also likely to make up for a proportion of China’s anticipated steel production decline in the post-plateau era, with the country expected to quadruple annual steel demand in the coming quarter century compared to the start of this decade. Other emerging Asian economies will also lift steel production capacity. These regions today have very low steel stocks at about two tonnes per capita, offering considerable potential for demand growth in the decades to come.
Iron ore
The iron ore price was relatively steady in H1 CY25 compared to the previous six months. The market was supported most recently by the elevated blast furnace run rate in China and several disruptions to iron ore supply, including weather-related impacts to seaborne supply and the extended impact of safety inspections at Chinese domestic iron ore mines. This led to iron ore inventory in major Chinese ports declining. With seaborne supply expected to normalise in the near-term, port stocks in China are expected to re-build over the coming year.
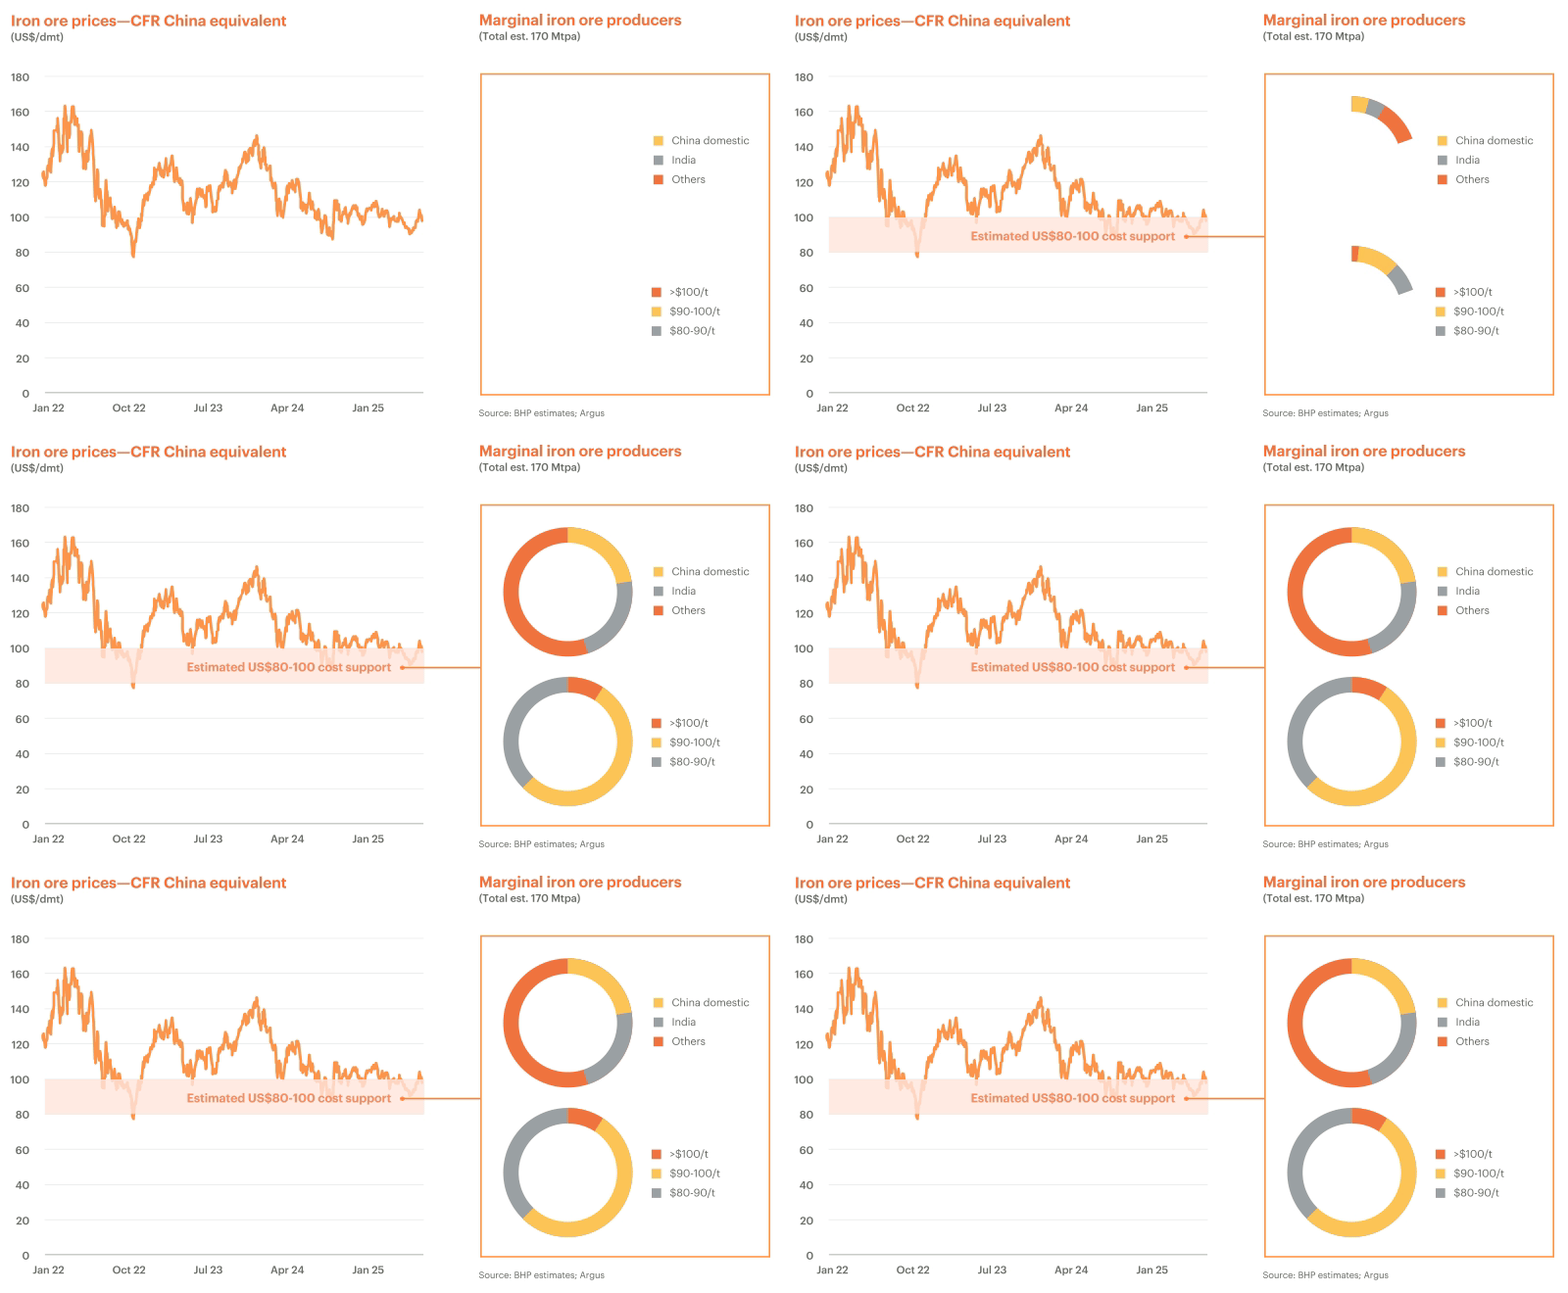
Our estimate of cost support remains at $80–100/t CFR, and we expect a sizeable portion of marginal seaborne supply to start to come under pressure when prices breach the upper half of this range in the near-term. Cost support is comprised of a relatively dense bench of higher–cost suppliers, totalling ~180 Mt of supply (or enough to produce 10% of Chinese pig iron demand). These higher-cost suppliers include: 1) junior suppliers in Australia, and other regions, 2) China marginal players; and 3) lower–grade Indian exports. We estimate that 110-120 Mt of this higher cost supply has a CFR cost above $90/t, with the remaining 60-70 Mt sitting between $80-90/t. Of the 180 Mt, about ~3/4 is seaborne and ~1/4 is domestic Chinese concentrates. To persistently dip below the cost support range, some combination of lower demand and increased supply from low-cost producers would have to emerge and displace all this volume.
Looking out a few years, we consider the entry of new, higher-grade supply from the Simandou project in Guinea to be a near certainty, with first tonnes expected by the end of CY25. We expect these volumes to primarily produce higher grade fines, rather than mid-grade brackets, like those from the Pilbara. Additional tonnes are likely to be produced by the major suppliers as well, including the plans that BHP has outlined. We also note the ambitions of the Chinese domestic iron ore industry to increase production, while the scrap-to-steel ratio in China is also assumed to be heading consistently higher.
These evolving market dynamics will make it even more important to create competitive advantage and to grow value through driving exceptional operational performance.
Beyond the high-cost support bench, there are several offsetting factors that could shield against downward price movement owing to supply additions in the medium term. Traditional supply basins might require more investment to sustain production in the face of grade decline and resource depletion. Wood Mackenzie estimates ~250Mt of operating supply will deplete in the seaborne market over 2025-2035. We also expect India, which reliably exported an average of ~30Mt per annum (pa) in the past nine years to the seaborne market, to increasingly become an opportunistic importer, with potential upside during periods of domestic supply disruption.
Steelmaking coal
The steelmaking coal price has hovered close to cost support over the last several months, as seaborne demand weakness, particularly in Europe and developed Asia, more than offset ongoing seaborne supply disruptions. Indian pig iron output, which has been growing over the last year off the back of new blast furnace capacity coming online, has helped to offset some of the ongoing weakness. Trade flows have also been adjusting, not least because of an -11% drop in Australian seaborne exports over H1 CY25 due to mining disruptions and wet weather, which led to Indian steelmaking relying less on Australian coals and more on Russian supply over the half. BMA stood out amongst its competitors against this backdrop, achieving a +5% YoY production increase and maintaining its production of higher-quality steelmaking coals despite adverse conditions.
Another factor weighing on the market more recently was that China, previously the major clearing market for seaborne steelmaking coal, shifted to an opportunistic exporter amidst a domestic supply glut—though export volumes were still limited. Mongolian exports to China also declined by -16% YoY in H1CY25 due to the surplus of Chinese supply. It appears these dynamics could alleviate soon, however. Many market players are speculating that Chinese government intervention could help to control domestic supply in H2 CY25, which has led to an increase in Chinese coking coal prices in July-August.
Longer term, our analysis suggests that blast furnace iron making, which depends on coke made from steelmaking coal, is unlikely to be displaced at scale by emergent technologies for decades. The argument hinges partly on the sheer size of the existing stock of Blast Furnace-Basic Oxygen Furnace (BF-BOF) capacity (70% of global production today) and the still quite young blast furnace fleet in China – the major producer, but also on the large amount of new blast furnace capacity expected to come online in India and Southeast Asia in the coming decade. India has a strong pipeline of blast furnaces expected online in the near-term, with a government target to install 300 Mtpa of steel capacity by 2030. Southeast Asia, too, has ~100 Mtpa of steelmaking capacity under construction or in the pipeline, of which ~80% are blast furnaces. We also expect higher-quality steelmaking coals to be valued for their role in reducing the GHG emissions intensity of blast furnaces as carbon costs increase.
Most committed and prospective steelmaking coal supply projects are expected to produce mid-quality or lower grades of coal, while industry intelligence suggests that the quality of coal from older mines continues to decline as they approach depletion. According to Wood Mackenzie, large new hard coking coal projects will be consistently needed by the early 2030s to meet projected demand under its base case production outlook. Additionally, new seaborne supply will increasingly be challenged as Queensland’s royalty and approvals environment remain unconducive to long-life capital investment.
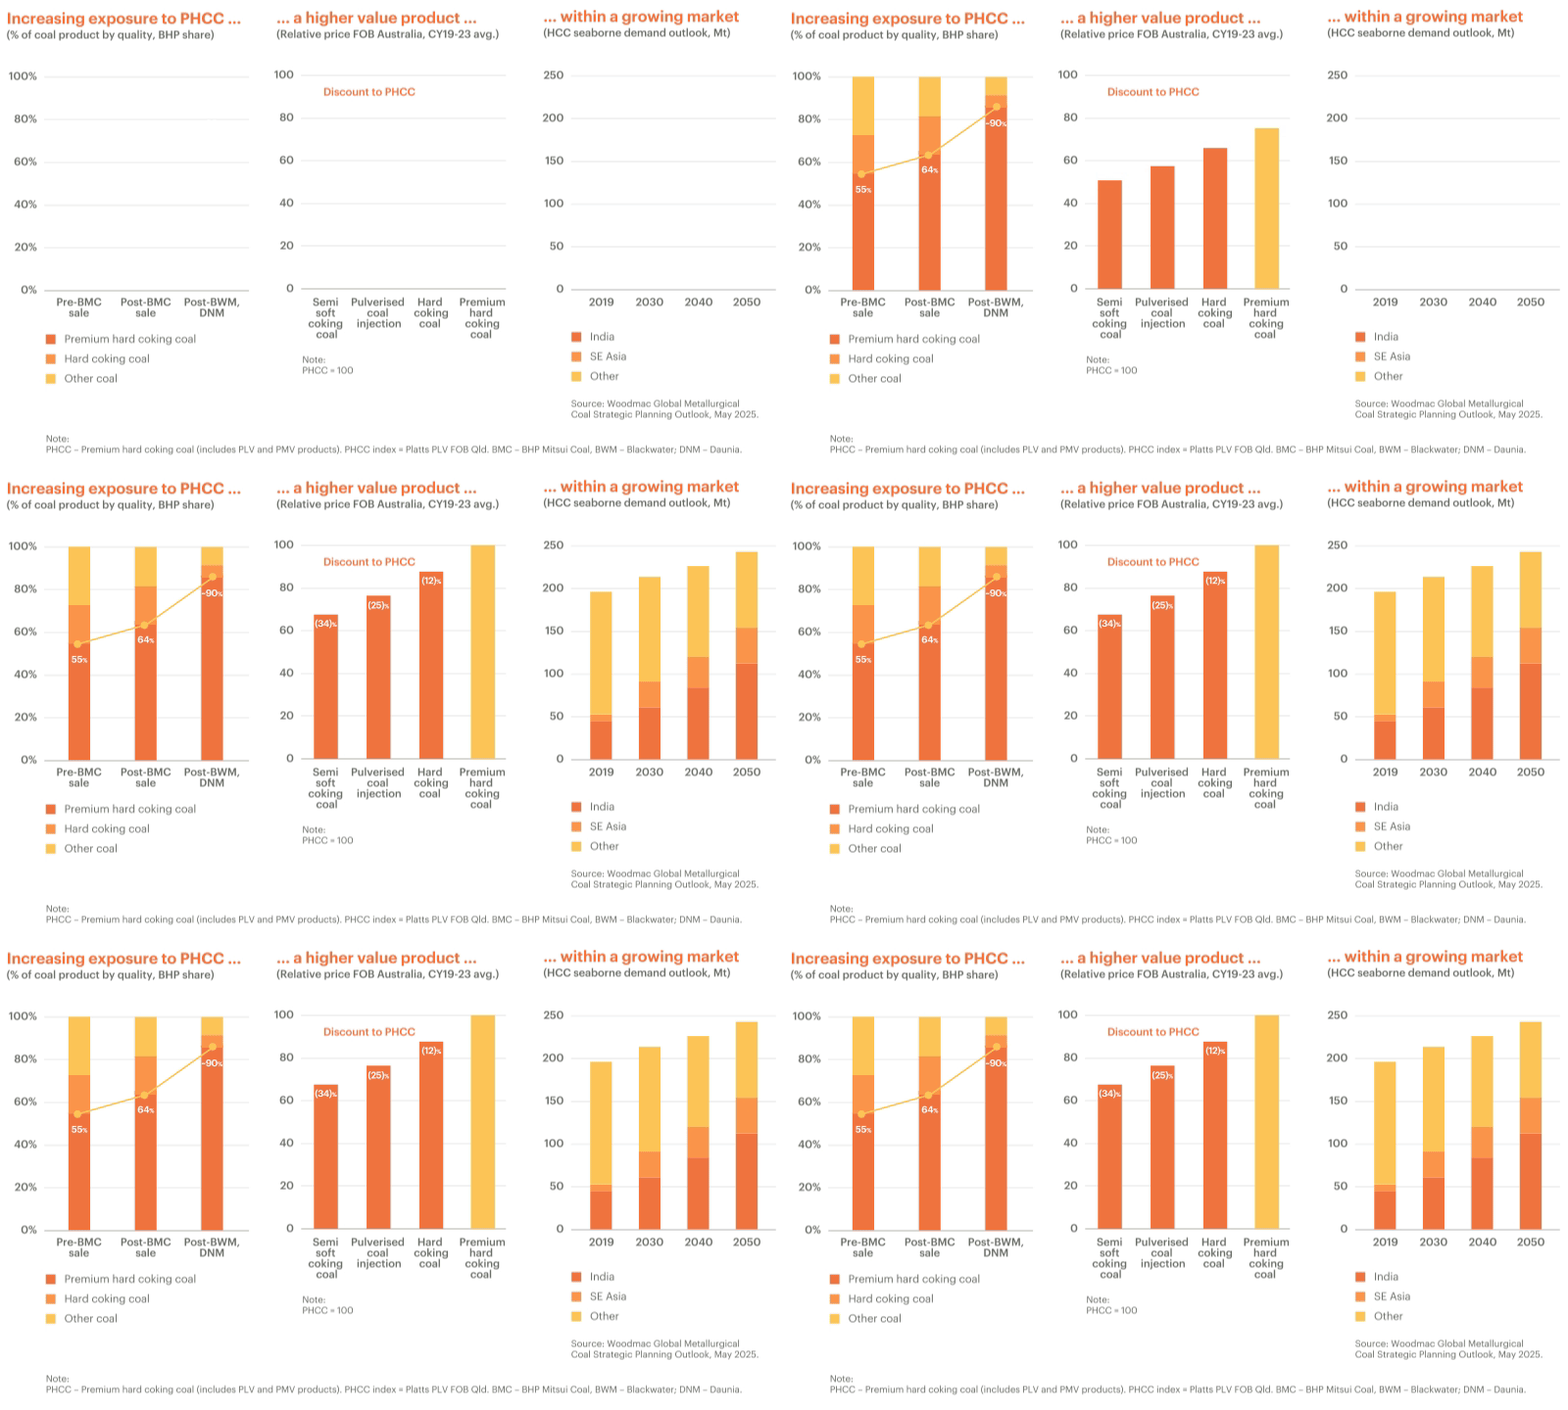
BHP is competitively placed to take advantage of these future trends: today, ~90% of BMA’s products are priced based on PLV HCC FOB Qld indices (up from 55% in 2020), making it one of the largest suppliers of this higher-quality coal in the seaborne market.
Copper
Copper markets were heavily influenced by the threat of tariffs on US copper imports for much of the last six months. US-based COMEX traded at a significant premium to the London Metals Exchange (LME) price, which incentivised much of the world’s available cathode to be shipped to the United States. This led to declining copper inventories elsewhere and a lifting of LME copper prices above $10,000/t by June 2025. The US has since announced tariffs would exclude copper cathode, largely closing the COMEX-LME differential. Forward curves suggest the market still sees a risk of future tariffs, which could be a factor that continues to influence trade flows.
Turning to Asia, Chinese copper demand was stronger than expected over the last year. Government schemes to replace old machinery and consumer durables, strong energy transition demand (see above), and a push to diversify and export as many goods as possible prior to tariffs coming online led to demand surging +8%YoY in H1 CY25, a significant upgrade after already achieving a healthy +4.2% in CY24.
Over the next year, we expect the copper market will be broadly balanced. Chinese copper demand in FY26 should remain strong, though growth likely will decelerate off the high base as tariffs ramp up and stimulus programs ease. Offsetting this deceleration, however, are reductions to expected mine supply, with the Americas, Europe and Southeast Asia all expecting downgrades and delays. The copper market could also see disruptions to scrap trade because of rising trade barriers – the US exported around 0.6 million tonnes of copper in scrap in CY24, a significant volume in a market that typically balances in the low hundreds of thousands of tonnes.
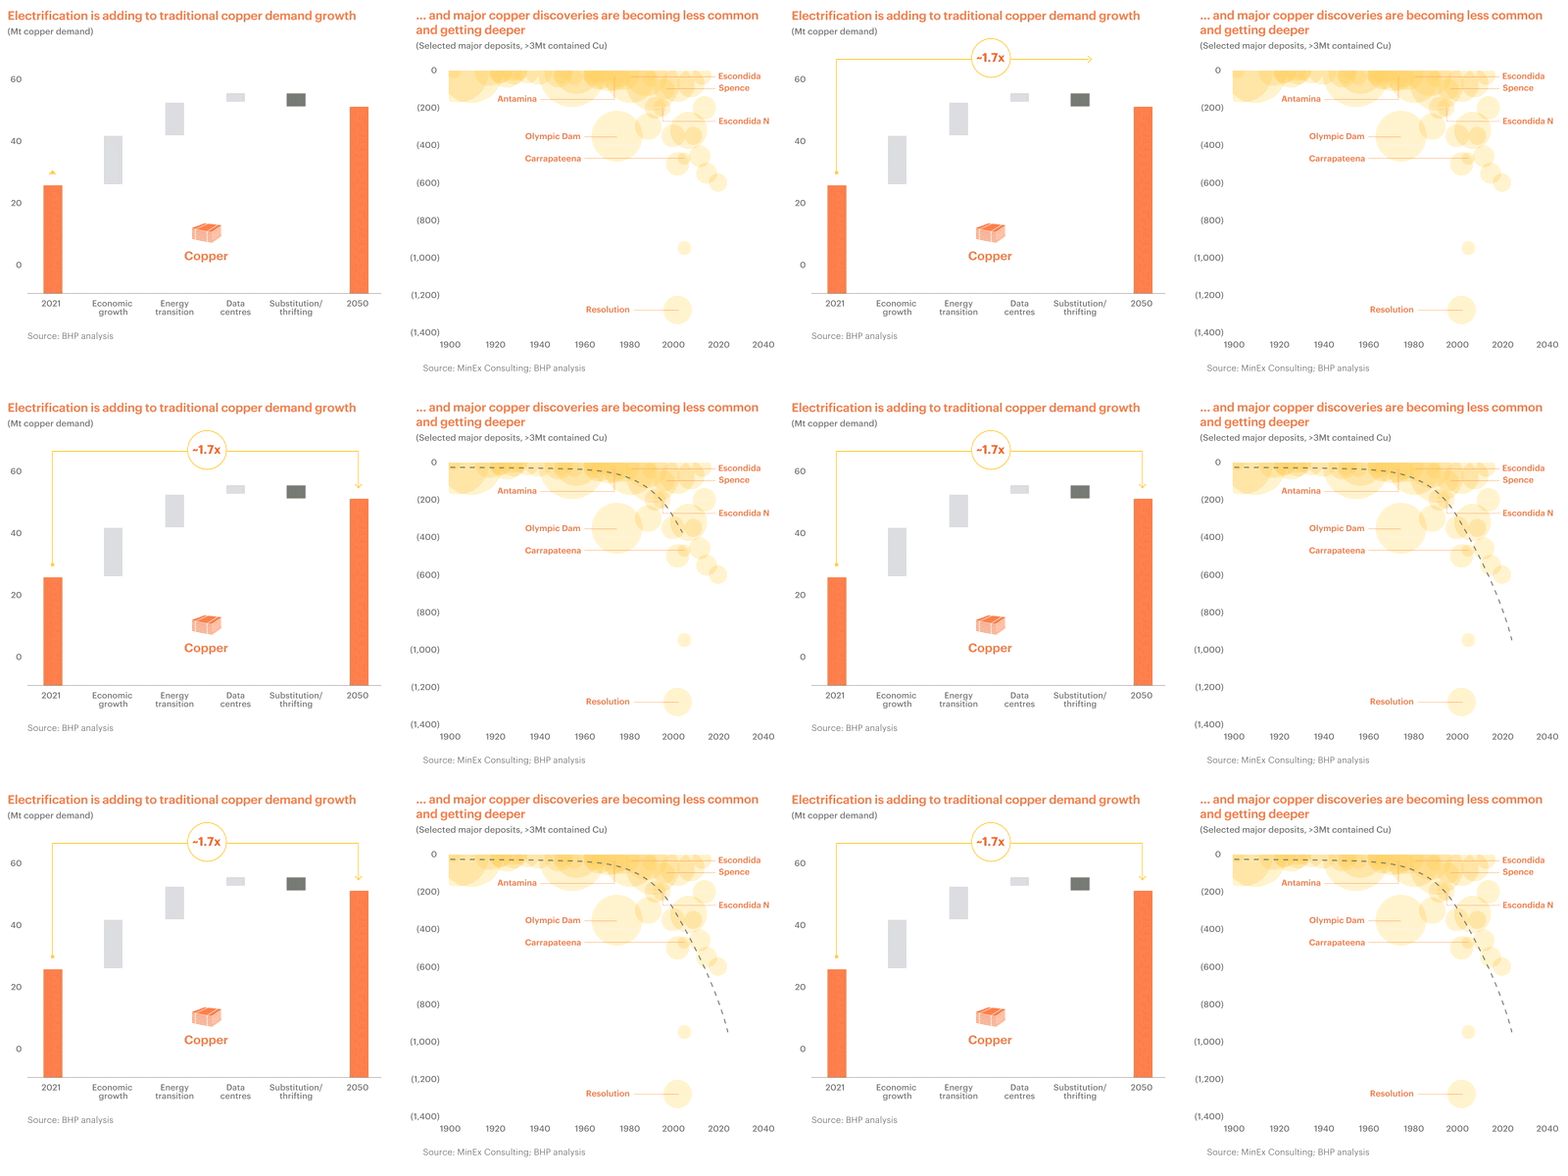
We maintain our long-term view that global demand is expected to grow from 32 million tonnes currently to over 50 million tonnes by 2050. In the medium term, we expect as-yet uncommitted mine supply to be required to keep pace with growing demand, with supply from current and committed mines peaking in the late 2020s. The world is expected to need around 10 million annual tonnes of new mine supply over the next 10 years to meet growing demand from traditional sectors in developing countries, as well as the emerging needs of the digitalisation and energy transition megatrends.
Lower grades, increased depth and complexity of deposits present technical challenges for primary supply, while growing regulatory, environmental and sustainability commitments usually add to the cost of developing a mine.
The clear uptrend in capex estimates as project studies have been updated reflects these challenges – a sample of brownfield projects in Latin America suggest a 65% increase in capital intensity since 2010. Technological progress can help at the margin to improve the productivity of existing operations, including innovative leaching. However, this inflationary trend may prove stubbornly persistent. For future mine supply to be incentivised, we expect prices still need to rise from today’s levels to be sufficiently high to trigger the investment that will be needed.
Potash
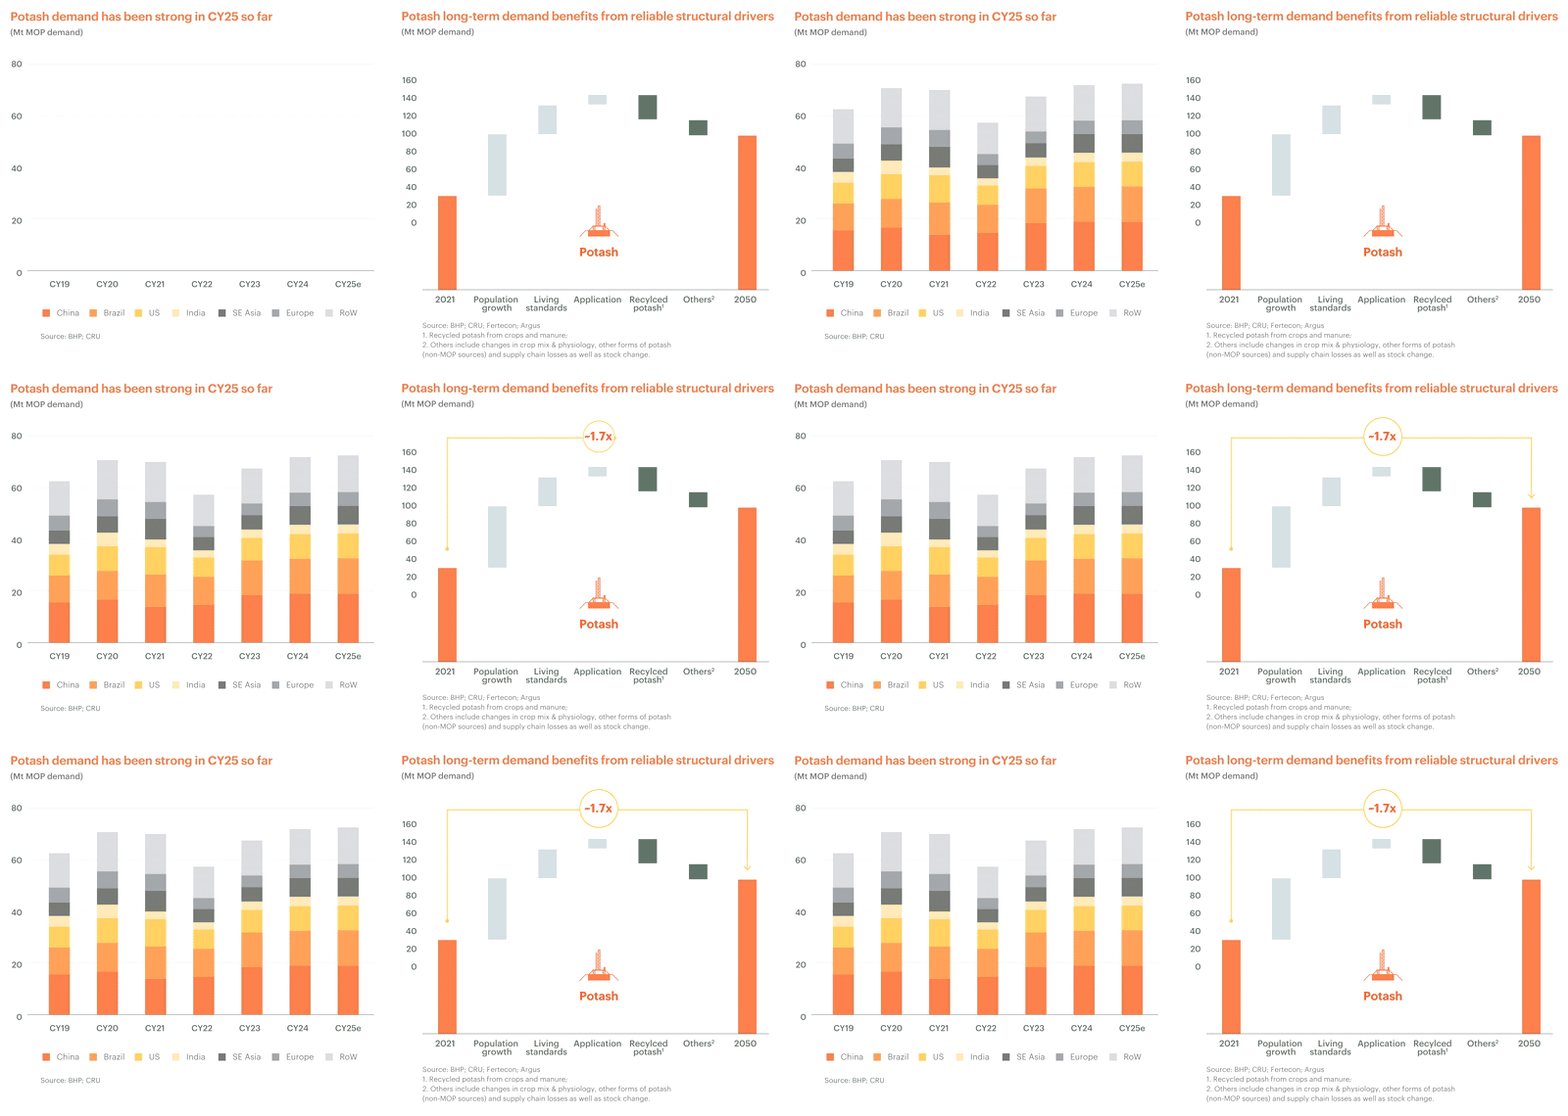
Potash benchmark prices rose over H1 CY25 as markets tightened on strong demand and good affordability in key regions. New contracts were signed for China and India at $346/t and $349/t respectively, up ~25% from the previous year. With the recent price appreciation, potash affordability has moderated, though it remains the most affordable of the bulk macronutrient fertilisers.
India showed the strongest demand growth in the first 5 months of the CY (the latest available data), with imports up over 20% YoY. Demand in other key regions has remained solid and global potash deliveries in CY25 are expected to surpass the previous record set in CY24. The price lift was also supported by Russia and Belarussian supply basins announcing several maintenance projects. In aggregate, the market is expected to be balanced in the near-term as supply growth from Russia, Belarus and Laos is met with higher demand.
In the medium term, potash demand is expected to continue to benefit from a rising and wealthier population and changing diets, while new supply from traditional and emerging basins is also expected to be added to the market over this period.
Longer-term, potash offers attractive fundamentals, with demand expected to grow ~70% from 2021 levels. Demand stands to benefit from the intersection of global megatrends: rising population, improving living standards, changing diets and the need for more sustainable and efficient use of arable land for agriculture.
Nickel
The nickel market remained in surplus in H1 CY25, with prices trending generally lower across the period. While demand for electric vehicles in China has grown strongly, sales penetration in OECD countries has been below expectations (see above). The share of non-nickel battery chemistries has also risen, weighing on near-term nickel demand growth.
These trends are expected to continue in the near-term, suggesting that the market will remain in surplus. Indonesian supply continues to grow strongly, though Indonesian government policy remains a key factor for future growth.
Turning to the longer–term fundamentals, we still believe that nickel will be a substantial beneficiary of the global electrification megatrend.
Uranium
Excitement in the uranium market has eased from its peak in CY23-24, with the spot price falling in H1 CY25, but still elevated relative to the historic average. We expect the upstream market to be broadly balanced in the near-term, with steady demand being met by incremental supply volumes. However, upward price volatility could still be pronounced owing to inefficiencies in the nuclear fuel value chain. The removal of waivers on US imports of Russian enriched nuclear fuel (expected in CY27) and a mismatch between growing fuel demand but limited investment in conversion and enrichment could push prices up periodically. These factors should keep uranium prices elevated, supporting by-product revenue streams for BHP’s Copper South Australia.
Longer-term, we expect new upstream uranium supply to be needed by 2030, as nuclear power plant life extensions in the OECD are supplemented by steady nuclear capacity growth in the developing world. We remain cautious about some ambitious government targets aiming to boost nuclear capacity, as the technology is still challenged by relatively high build costs, complex regulatory bottlenecks, long lead times and community opposition to siting close to population centres.
Nevertheless, growing interest in the role of nuclear in supplying power to data centres, steady progress in small modular reactor technology, and more supportive policy in recognition of its last-mile decarbonisation benefits in the power sector could all provide upside in the long run.
As primary uranium production expands to meet rising demand, suppliers will continue to face structural pressures including regulatory compliance, increasing capital intensity, and geological constraints, which are expected to support a stronger long-term price environment.
Important notice:
This article contains forward–looking statements, which involve risks and uncertainties. Forward-looking statements include all statements, other than statements of historical or present facts, including: statements regarding trends in commodity prices and currency exchange rates; demand for commodities; global market conditions; reserves and resources estimates; development and production forecasts; guidance; expectations, plans, strategies and objectives of management; our expectations, commitments, targets, goals and objectives with respect to social value or sustainability, including decarbonisation and natural resource management; climate scenarios; approval of projects and consummation of transactions; closure, divestment, acquisition or integration of certain assets, ventures, operations or facilities (including associated costs or benefits); anticipated production or construction commencement dates; capital costs and scheduling; operating costs and availability of materials and skilled employees; anticipated productive lives of projects, mines and facilities; the availability, implementation and adoption of new technologies, including artificial intelligence; provisions and contingent liabilities; and tax, legal and other regulatory developments.
Forward–looking statements may be identified by the use of terminology, including, but not limited to, aim’, ‘ambition’, ‘anticipate’, ‘aspiration’, ‘believe’, ‘commit’, ‘continue’, ‘could’, ‘desire’, ‘ensure’, ‘estimate’, ‘expect’, ‘forecast’, ‘goal’, ‘guidance’, ‘intend’, ‘likely’, ‘may’, ‘milestone’, ‘must’, ‘need’, ‘objective’, ‘outlook’, ‘pathways’, ‘plan’, ‘project’, ‘schedule’, ‘seek’, ‘should’, ‘strategy’, ‘target’, ‘trend’, ‘will’, ‘would’ or similar words.
These statements discuss future expectations or performance or provide other forward-looking information. Forward–looking statements are based on BHP management’s expectations and reflect judgements, assumptions, estimates and other information available, as at the date of this article and/or the date of BHP’s scenario analysis processes.
In addition, there are limitations with respect to scenario analysis, including any climate-related scenario analysis, and it is difficult to predict which, if any, of the scenarios might eventuate. Scenario analysis is not an indication of probable outcomes and relies on assumptions that may or may not prove to be correct or eventuate.
Except as required by applicable regulations or by law, BHP does not undertake to publicly update or review any forward–looking statements, whether as a result of new information or future events. Past performance cannot be relied on as a guide to future performance.
No offer of securities
Nothing in this article should be construed as either an offer or a solicitation of an offer to buy or sell BHP securities, in any jurisdiction, or be treated or relied upon as a recommendation or advice by BHP.
Reliance on third party information
The views expressed in this article contain information that has been derived from publicly available sources that have not been independently verified. No representation or warranty is made as to the accuracy, completeness, or reliability of the information. This article should not be relied upon as a recommendation or forecast by BHP.
BHP and its subsidiaries
In this article, the terms ‘BHP’, the ‘Company’, the ‘Group’, ‘BHP Group’, ‘our business’, ‘organisation’, ‘we’, ‘us’, ‘our’ and ‘ourselves’ refer to BHP Group Limited and, except where the context otherwise requires, our subsidiaries. Refer to the ‘Subsidiaries’ note to the Financial Statements in the BHP Annual Report for a list of our significant subsidiaries. Those terms do not include non–operated assets. Our non-operated assets include Antamina, Samarco and Vicuña.
Footnotes:
1 Data and events referenced in this article are current as of August 15, 2025. All references to financial years (FY) are June-end as per BHP reporting standards. For example, “financial year 2025” is the period ending 30 June 2025. CY refers to the calendar year (1 January to 31 December). All references to dollars or “$”are US dollars unless otherwise stated. Unless otherwise stated, data is compiled by BHP from a wide range of publicly available and subscription sources, including national statistical agencies, Bloomberg, Wood Mackenzie, CRU, IEA, ILO, IMF, Argus, CREIS, Fertecon, FastMarkets, SMM, Parker Bay, MySteel, Platts, LME, COMEX, SHFE, ICE, DCE, SGX, an S&P Global, among others.
2 Capable of lower absolute GHG emissions or GHG emissions intensity than the current state or the conventional or incumbent technology, as applicable.
Get the latest BHP news alerts, straight to your inbox
Get BHP news first. Stay in touch with our latest updates, investor news and media releases.


