31 October 2016
As a company we have made no secret of our liking for copper in the medium to longer term.
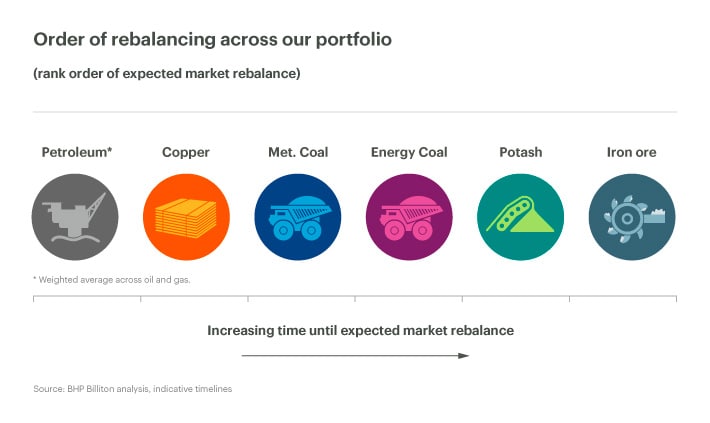
We anticipate it will be the first mineral commodity in our portfolio to return to fundamental market balance1 [chart 1]. Structural grade decline creates an ongoing imperative for new copper supply [chart 2]. That future supply will likely be higher cost, based on a range of macroeconomic, socio-political and geographic factors - as well as idiosyncratic issues we track on a project by project basis. Chief among these is the rising costs associated with a greater reliance on desalinated rather than aquifer water.


On the demand side, copper is a metal that thrives through the middle-income stage of a country’s economic development, which is associated with a lift in the consumption share of total activity. That comes with the mass penetration of copper intensive consumer goods, like household electronics. There is also a pronounced lift in copper absorption as consumers graduate beyond affordable, no frills houses and cars in favour of highly accessorised versions that are literally more ‘wired’. China has entered this stage. India and the populous regions of South East Asia will follow in the fullness of time.
We acknowledge that total copper demand is subject to ongoing substitution and miniaturisation ‘taxes’. Cheaper materials with inferior but still acceptable characteristics in use can be, and are, substituted for copper in traditional applications such as certain components of the power grid. In addition, we’re keeping a close eye on the availability of scrap metal as a competitor for concentrate and cathode. We remain alert to these factors and incorporate them in our long term view.
As a powerful offset to substitution, copper is superbly placed to benefit from expanded end use demand on the back of observed trends in technology, which we expect will become material from around the middle 2020s. Two such technological streams – electric vehicles (EVs) and renewable energy – are emerging as key areas of growth as the world transitions towards lower emissions energy.
Let us consider power generation first. Wind and especially solar power generation capacity are both far more copper hungry per unit of electricity produced than plants utilising non-renewable energy sources. The most striking gap is perhaps between coal and solar generation. Coal generation facilities contain about 2kgs of copper per KW; solar requires about 5kgs. In other words, the copper coefficient for solar capacity is 2½ times the one for coal capacity. These coefficients sit at the heart of our demand driver trees; and getting those coefficients right is a major motivator for our obsession with building our view of the world from the bottom up.
What about EVs? The average conventional internal combustion engine (ICE) vehicle contains around 20kgs of copper.2 The average hybrid vehicle uses around 40kgs, 2 times higher than an ICE. The average pure battery powered EV contains around 80kgs, producing a copper coefficient 4 times the ICE level.
In a previous edition of Prospects, we predicted that the global EV fleet will expand from approximately 1 million vehicles today to around 140 million in 2035. That would displace about 2 million barrels of oil demand per day in that year, worth about US$37 billion annually at today’s prices in a US$1¾ trillion market.
However, those same vehicles will consume around 11 million tonnes of copper in their production. Subtracting the copper that would have been used in the ICEs ‘displaced’ by EVs, and that figure comes down to around 8½ million tonnes of genuine new demand – worth around US$38 billion dollars at today’s copper price. That 8½ million tonnes is equivalent to around one-third of total refined copper demand today.
That sounds impressive – and it is. However, it could be even better. It is likely that the copper intensity of EVs will grow over time, rather than stand still at 80kgs per unit. If that intensity rises to 105, which we believe it can, then the value of the demand uplift from the swelling of the EV fleet rises to almost 12 million tonnes, or more than half of the current global market for refined copper.
The numbers outlined above are derived from our mid case view of the long run development of the transport sector. As with any long term forecast, there are considerable margins of uncertainty attached to precise estimates. To address and ultimately narrow that uncertainty, we run a diverse set of alternatives through our models. This enables us to define the future range with more confidence. We work inwards from the ‘extreme but unlikely’ paths in the tails of the distribution of possible futures, to reach the ‘challenging but plausible’ territory that will define our high and low cases for planning purposes. As an aside, our high case for EVs is more than double the mid. That idea ought to quicken the pulse of anyone with a fiduciary interest in the red metal.
[1] We use the term ‘fundamental’ market balance to differentiate between a sustainable position reached in the absence of transitory factors on the supply side, such as the logistical constraints currently operating in the metallurgical coal market. This distinction also informs our rank ordering in chart 1.
[2] This is a global average. For China alone, it is around 14-15kgs.
Get the latest BHP news alerts, straight to your inbox
Get BHP news first. Stay in touch with our latest updates, investor news and media releases.


