




How BHP is working towards net zero emissions by FY2050: Insights from BHP's ESG roundtable
Interview with Maria Palomar, Group Officer Sustainability and Social Value
Summary:
- BHP has made progress on operational decarbonisation in FY2026, with operational emissions 33 per cent below our FY2020 baseline, and renewable sources providing 80 per cent of electricity at our operated assets globally1.
- The next phase will be more complex, as we look beyond renewable power to the harder task of displacing diesel across large-scale mining systems that have been designed around it for decades.
- The same practical, operational lens is shaping our approach to social value, where everyday decisions in freight, procurement and partnerships are helping create value for communities and the business.
At first glance, the next phase of mining decarbonisation sounds simple: replace diesel equipment with electric alternatives and power them with renewable energy. In practice, it is far more complex.
That was one of the key messages from BHP’s recent ESG roundtable, which looked at operational greenhouse gas (GHG) emissions – Scopes 1 and 2 emissions from our operated assets, the practical work underway to support our longer-term pathway, and how social value is helping BHP achieve business value.
BHP Insights: Where is BHP now on operational greenhouse gas emissions?
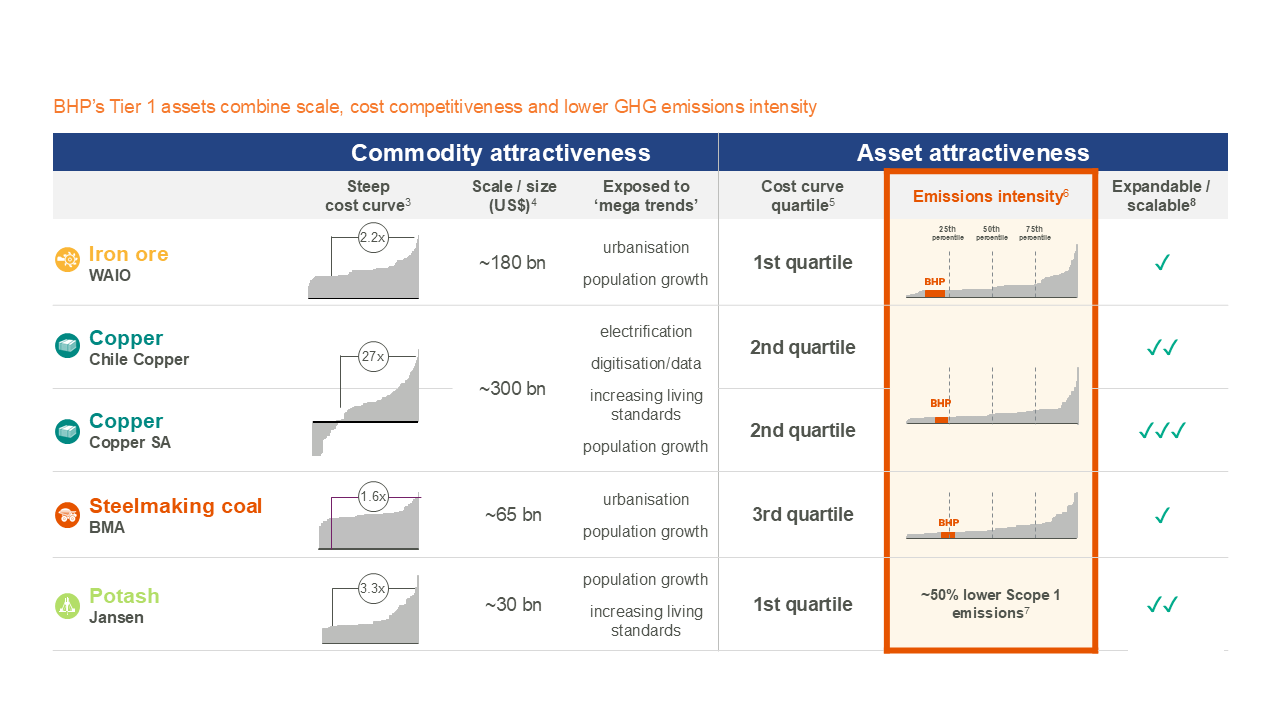
Maria:BHP operates among the lower greenhouse gas emission intensity assets in the world – for CY2025, first quartile performance for our iron ore and copper operated assets and sitting across the first and second quartiles for steelmaking coal (see Figure 1).
In FY2026, our operational greenhouse gas emissions were 33 per cent below the company’s FY2020 baseline. Renewable power sources provided 80 per cent of electricity at our operated assets globally in FY2026. This included 100 per cent renewable electricity at operations in Chile, up to 30 per cent for Western Australia Iron Ore’s port operations at Port Hedland, and 35 per cent at Copper South Australia (SA). And from 1 July this year, BMA is at 100 per cent renewable electricity based on forecast demand.
Based on what we know today and current methodologies, we remain on track to meet our medium-term target to reduce operational GHG emissions by at least 30 per cent by FY2030, compared with our FY2020 baseline.
But progress will not be linear. Our portfolio of high-quality growth projects has the potential to deliver around 3 per cent per year growth over FY2027 to FY20302. As increased production comes online and new operations commence, there is potential for emissions to increase in the near term before declining again by FY2030. The challenge is to keep reducing emissions where proven solutions exist today, while progressing the technologies, infrastructure and partnerships needed to address harder-to-abate sources of emissions over time.
Figure 1: Leading assets in commodities the world needs
BHP Insights: What about beyond FY2030? Is there a potential pathway to achieving BHP’s goal of net zero emissions by CY2050?
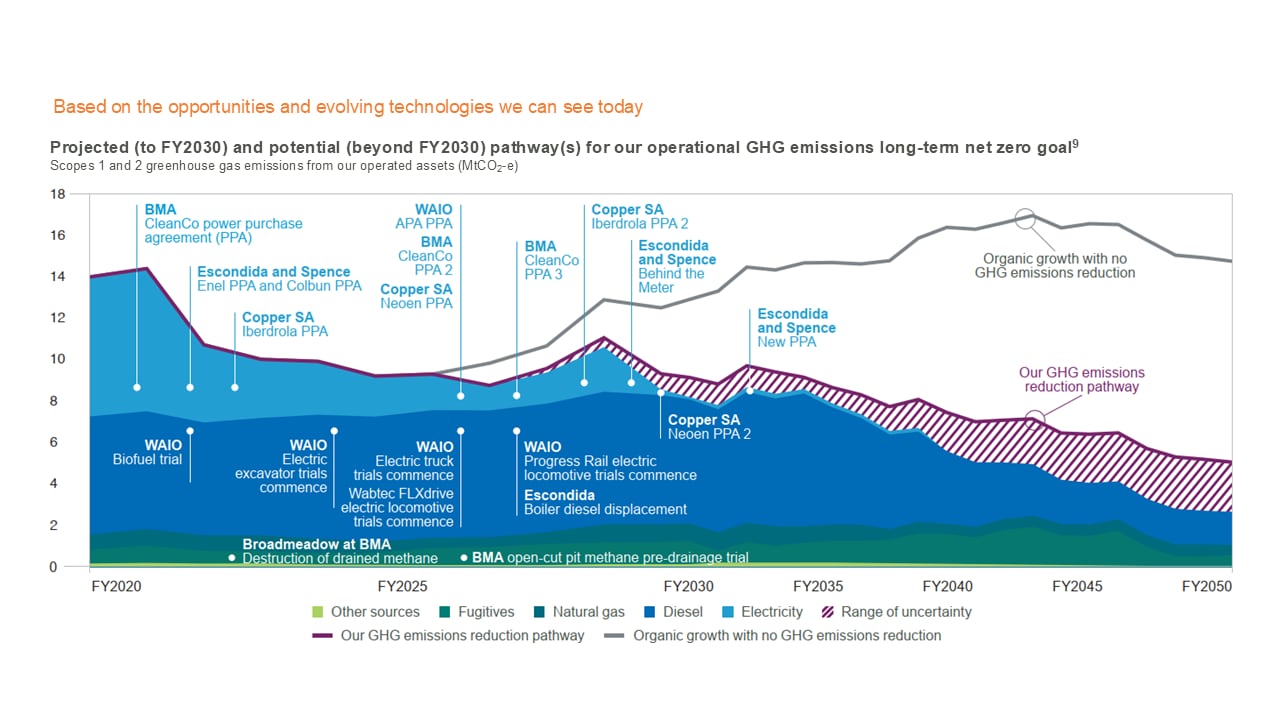
Maria:We have shared the pathways (Figure 2) we see today to BHP’s goal of net zero operational emissions by CY2050, while recognising there is more uncertainty beyond FY2030 because the pathway depends on technologies continuing to mature.
The biggest opportunity is diesel displacement across our fleets, rail and mobile equipment, supported by electrification, and supporting power infrastructure. We’re also looking at options such as hybrid solutions, power-agnostic platforms, sustainably sourced biofuels and methane reduction technologies and the potential application across our business, with the learnings from today’s work helping shape the potential pathways in the future.
Figure 2: Net zero 2050 operational GHG emissions potential pathway
BHP Insights: Why is replacing diesel equipment with electric alternatives and powering them with renewable energy more complex in practice?
Maria: Because it requires changes to the whole mining system, and not just the equipment. Electric fleets need new charging, power and operating models, and those changes can affect safety, productivity, cost, congestion and reliability at scale.
BHP Insights: What does the electrification of haul trucks look like in practical terms?
Maria: One of the biggest levers to enable electrification is charging.
A theoretical current-generation 220-tonne class battery-electric haul truck with a 3MWh battery takes around 30 minutes to charge. Depending on the truck’s duty cycle – how and where it is operating, it would need six to eight charging stops every 24 hours.
By comparison, a diesel truck refuels once every 24 hours in about 15 minutes.
For a single truck, the additional charging time could represent around 1,000 hours each year that would otherwise be spent hauling material. For a fleet of 100 trucks, for example, that could equate to around 100,000 lost truck hours per year. The numbers quickly multiply.
Adding more trucks may recover some of those tonnes, but it would also bring more capital, more congestion, greater power demand, more maintenance and additional supporting infrastructure. At that point, we would not just be changing the truck. It would change the design and performance of the whole mining system itself.
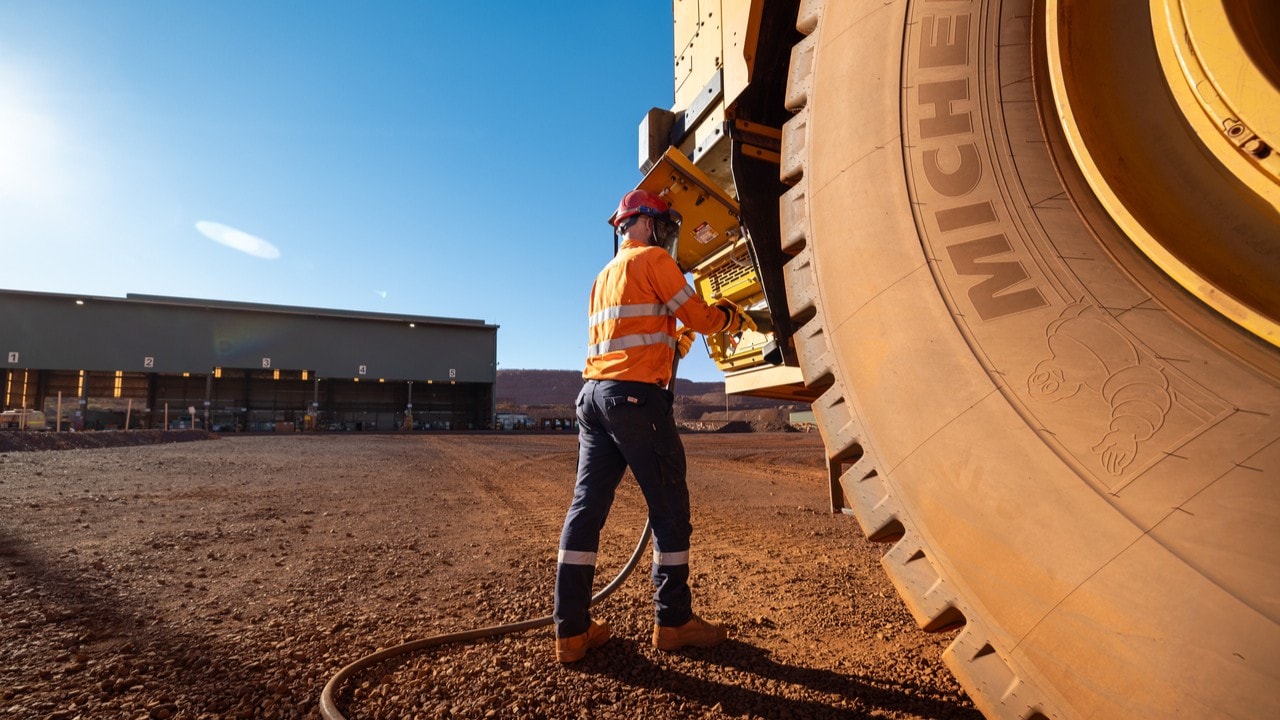
Image: Static charging at our battery-electric haul truck trial, Jimblebar, WAIO
BHP Insights: Could dynamic charging help?
Maria: Emerging technologies such as dynamic charging have the potential to change the equation. Dynamic charging would allow trucks to charge while moving, reducing parked charging time.
We see potential for a future system that combines static and dynamic charging, with dynamic charging focused on long, high-traffic haul routes where it can deliver the most value. We plan to trial Caterpillar’s Dynamic Energy Transfer system in FY2027 to help advance the technology and determine how it could support a future production-scale system.
Each trial is designed to build the evidence base: what works, what does not, and what still needs to mature before major investment decisions are made.
BHP Insights: Will the same solution work across all BHP assets?
Maria: Different assets face different challenges. Encouraging progress is being made with ~220 tonne haul trucks, but BHP’s Chilean copper operations rely on significantly larger truck classes, which are not yet available for trials.
While electrification remains the long-term aim, as I mentioned, the company is also assessing medium-term options such as power-agnostic platforms, hybrid solutions and the availability, cost and volume of sustainably sourced biofuels.
BHP Insights: You also spoke about social value. How does that connect to business performance?
Maria: I see the connection between social value and business performance in the way BHP makes business decisions in procurement, partnerships, logistics and growth planning.
Copper SA is a good example. The team there redesigned their freight network in partnerships with rail freight business, Aurizon, following the integration with OZ Minerals, and this change is expected to move around 1.3 million tonnes of freight by rail each year, remove around 13 million truck kilometres from South Australian roads, and reduce around 20,000 tonnes of Scope 3 emissions annually10.
But the value is broader than the emissions outcome. It also means fewer impacts on regional communities due to heavy vehicle movements, less pressure on public infrastructure and a logistics system that can support Copper SA’s future growth.
Another example is WAIO’s railway ballast contract. WAIO needed a reliable supply of ballast to maintain the rail infrastructure that underpins delivery across the system. Instead of treating this as a straightforward procurement exercise, the team looked at how the contract could also support Traditional Owner participation and local businesses, and keep more value in the region.
By sourcing through a Traditional Owner supplier and using local quarries, the contract helped strengthen local participation in BHP’s supply chain, reduce haulage distances and improve supply reliability, while delivering around A$18 million in annual savings.
BHP Insights: What should readers take away from the ESG roundtable?
Maria: Firstly, that BHP has made strong progress on operational decarbonisation in FY2026, with emissions 33 per cent below our FY2020 baseline11, but the next phase will be harder. It will require new technology, new infrastructure, disciplined trials, practical partnerships and careful systems design. The work underway today is about building confidence in what can be deployed safely, reliably and at scale to help BHP make future investment decisions with ambition and discipline.
Secondly, that BHP has been deliberate in connecting social value to business performance. Social value is increasingly being treated as a capability at BHP, showing up in the choices we make – in procurement, workforce design, partnerships, responsible production and governance. It’s these decisions that help shape resilience, performance through cycles, growth and, ultimately, long-term value.
Footnotes:
1 As evidenced by the surrender of renewable energy certificates. For more information on this calculation refer to the Sustainability Report in BHP’s 2026 Annual Report.
2 See “Forward-looking production information, assumptions and copper equivalent methodology” on slide 37 of the BHP full year results presentation dated 18 August 2026.
3 Cost curves for each commodity shown as follows: i) Iron ore – 2026 all-in adjusted costs (US$/dmt 61% Fe equivalent, CFR China); ii) Copper – 2026 C1 costs (net of by-products); iii) Steelmaking coal – 2026 value-in use all-in sustaining costs for the seaborne market; iv) Potash – 2035 FOB operating cost including royalties. Source for iron ore, copper and steelmaking coals: Wood Mackenzie’s 2026 cost curves. Source for potash: BHP analysis, macroeconomic assumptions and CRU. The numbers in circles are equivalent to the 90-95th percentile producer divided by the 25th percentile producer.
4 Market sizes consider demand for 2025 and average prices from 2015 to 2025. Source: BHP analysis.
5 Cost curve quartile positioning considers the following assets position within the respective commodity cost curves outlined in footnote 2: i) Iron ore – WAIO; ii) Copper – Chile Copper (production weighted average of Escondida and Spence) and Copper SA; iii) Steelmaking coal – BMA; and iv) Potash – combined Jansen Stages 1 and 2 potential forecast cost position. Source for iron ore, copper and steelmaking coal: BHP FY26 actual unit costs relative to Wood Mackenzie’s 2026 cost curve on a 12-months basis. Source for Potash: BHP analysis, macroeconomic assumptions and CRU.
6 For CY2025, the GHG emissions intensity of our production of our commodities is estimated to rank in the first quartile for our iron ore and copper and sitting across first and second quartiles for steelmaking coal mines of global mining operations analysed by CRU. This analysis is based on CY2025 data from CRU (as CRU data is prepared on a calendar year basis) and includes CRU’s assumptions and estimates of BHP’s operations. Emissions intensity charts are indicative only and are not intended to show relativities between commodities. For more information on the calculation refer to the BHP ESG Standards and Databook 2026 available at bhp.com/ESGSD2026.
7 Commissioning the Jansen potash project with a GHG emissions intensity of approximately 50 per cent lower Scope 1 emissions per tonne of product compared to the average potash mine in Saskatchewan. Based on ~2020 CRU data. Comparison includes solution mines in Saskatchewan.
8 Based on our views today, in terms of potential production in FY35 relative to FY26 or first production (in the case of Jansen) amongst our major assets: ✓ ✓ ✓ Copper SA production has potential for the greatest increase ✓ ✓ Chilean copper (Escondida and Pampa Norte potential production) and Jansen to increase significantly; and ✓ WAIO and BMA production to increase modestly. See “Forward-looking production information, assumptions and copper equivalent methodology” on slide 37 of the BHP full year results presentation dated 18 August 2026, the “Forward-looking statements section on slide 2 of the ESG roundtable 2026 presentation and the risk factors in the BHP Annual Report 2026, available at bhp.com.
9 Future GHG emissions estimates are based on current annual business plans. Historical GHG emissions are presented on an adjusted basis (refer to BHP Annual Report 2026, Sustainability Report Tabe 6a and 6b, available at bhp.com, for the basis of our adjustments). ‘Organic growth with no GHG emissions reduction’ represents business as usual GHG emissions forecast without abatement projects. ‘Our GHG emissions reduction pathway’ represents planned decarbonisation activities to reach our operational GHG emissions medium‑term target and further structural abatement towards our long‑term net zero goal (noting that activities to FY2030 comprise our GHG emissions reduction projected pathway and beyond FY2030 indicates our GHG emissions reduction potential pathway(s), reflecting the different degrees of certainty across the timeframes). Delivery of this pathway depends on these technologies becoming available, being deployed in the anticipated sequence and achieving the assumed emissions reductions. ‘Range of uncertainty’ refers to higher risk options currently identified that may enable faster or more substantive decarbonisation than our GHG emissions reduction potential pathway(s). BHP Annual Report 2026, Sustainability Report 7.6 available at bhp.com for the methodologies used to calculate our GHG emissions. Future GHG emissions calculation methodology changes may affect the information presented in this chart. Western Australia Nickel is not represented in the asset‑level activities shown in the chart, reflecting its temporary suspension of operations.
10 As estimated by Aurizon and based on Copper SA’s FY2024 production. All calculations assume the consumption of mineral diesel for both the prior road and new intermodal solution.
11 Baseline year and performance data adjusted; for the adjustments we make, refer to Sustainability Report 5.2 Climate-related targets in BHP’s 2026 Annual Report.


